Relative Strength Index (OSC)Hello everyone, I'm sorry that the previous open-source version was hidden due to the house rules, I've re-edited the description and re-posted it
(1) Indicator introduction
This is RSI indicator with original divergence algorithm
This indicator is plotted on the RSI and can display the divergence locations and corresponding divergence intensity
The tolerance of N Klines at the top or bottom positions for price and indicator is supported, which is set by the "Tolerant Kline Number"
Support the display of divergence intensity, that is, the REG/HID value displayed on the label, which is less than 0. The smaller the intensity value, the more obvious divergence
Support the filtering of divergence intensity, which is set by "Cov Threshold". The divergence that REG/HID divergence intensity greater than this value will be ignored
In the label, REG indicates regular top/bottom divergence while HID indicates hidden top/bottom divergence
In the label, SRC(x-y) indicates a divergence occurred from the x-th kline to the y-th kline
In the label, OSC(x-y) indicates a divergence occurred from the indicator corresponding to the x-th kline to the y-th kline
(2) Parameter introduction
- RSI Settings
Source: The source to calculate RSI, close by default
RSI Length: The length of RSI, 14 by default
- RSI Divergence
Pivot Lookback Right: Number of K-line bars recalling the pivot top/bottom point to the right
Pivot Lookback Left: Number of K-line bars recalling the pivot top/bottom point to the left
Max of Lookback Range: Maximum number of retracing K-line bars to find the pivot top/bottom point
Min of Lookback Range: Minimum number of retracing K-line bars to find the pivot top/bottom point
Tolerant Kline Number: Maximum tolerance in indexing top/bottom points of Klines and indicators
Cov Threshold: Divergence intensity, which is less than 0. The smaller the intensity value, the more obvious divergence
Plot Bullish: Whether to draw regular bullish divergence label
Plot Hidden Bullish: Whether to draw hidden bullish divergence label
Plot Bearish: Whether to draw regular bearish divergence label
Plot Hidden Bearish: Whether to draw hidden bearish divergence label
Happy trading and enjoy your life!
————————————————————————————————————————
各位朋友大家好,很抱歉之前的开源版本因为规则原因被隐藏,我已经重新编辑了说明并重新发布
(1) 指标说明
该指标绘制于 RSI 上,并在对应位置显示背离点以及背离程度
支持顶底位置 N 根K线的容差,由 Tolerant Kline Number 参数设置
支持背离强度的显示,即标签上显示的 REG/HID 值,该值小于 0,且越小说明背离程度越大
支持背离强度的过滤,由 Cov Threshold 参数设置, REG/HID 值大于这个值的背离会被忽略
标签中,REG 表示常规顶/低背离,而 HID 表示隐藏顶/底背离
标签中,SRC(x-y) 表示从当前第 x 根 bar 开始到第 y 跟 bar 出现背离
标签中,OSC(x-y) 表示从当前第 x 根 bar 所对应的指标开始到第 y 跟 bar 所对应的指标出现背离
(2) 参数说明
- RSI Settings
Source: 计算 RSI 指标的 source,默认为 close
RSI Length: 计算 RSI 指标的长度,默认为 14
- RSI Divergence
Pivot Lookback Right: 枢纽顶/底点往右回顾的 K线 bar 数量
Pivot Lookback Left: 枢纽顶/底点往左回顾的 K线 bar 数量
Max of Lookback Range: 回寻找枢纽顶/底点的最大回溯 K线 bar 数量
Min of Lookback Range: 回寻找枢纽顶/底点的最小回溯 K线 bar 数量
Tolerant Kline Number: K线和指标的顶/底点索引的最大误差
Cov Threshold: 背离程度,该值小于 0,且越小说明背离程度越大
Plot Bullish: 是否绘制常规底背离提示
Plot Hidden Bullish: 是否绘制隐藏底背离提示
Plot Bearish: 是否绘制常规顶背离提示
Plot Hidden Bearish: 是否绘制隐藏顶背离提示
祝大家交易愉快
在腳本中搜尋"rsi divergence"

Relative Strength Index (SRC)Hello everyone, I'm sorry that the previous open-source version was hidden due to the house rules, I've re-edited the description and re-posted it
(1) Indicator introduction
This is RSI indicator with original divergence algorithm
This indicator is plotted on the klines and can display the divergence locations and corresponding divergence intensity
The tolerance of N Klines at the top or bottom positions for price and indicator is supported, which is set by the "Tolerant Kline Number"
Support the display of divergence intensity, that is, the REG/HID value displayed on the label, which is less than 0. The smaller the intensity value, the more obvious divergence
Support the filtering of divergence intensity, which is set by "Cov Threshold". The divergence that REG/HID divergence intensity greater than this value will be ignored
In the label, REG indicates regular top/bottom divergence while HID indicates hidden top/bottom divergence
In the label, SRC(x-y) indicates a divergence occurred from the x-th kline to the y-th kline
In the label, OSC(x-y) indicates a divergence occurred from the indicator corresponding to the x-th kline to the y-th kline
(2) Parameter introduction
- RSI Settings
Source: The source to calculate RSI, close by default
RSI Length: The length of RSI, 14 by default
- RSI Divergence
Pivot Lookback Right: Number of K-line bars recalling the pivot top/bottom point to the right
Pivot Lookback Left: Number of K-line bars recalling the pivot top/bottom point to the left
Max of Lookback Range: Maximum number of retracing K-line bars to find the pivot top/bottom point
Min of Lookback Range: Minimum number of retracing K-line bars to find the pivot top/bottom point
Tolerant Kline Number: Maximum tolerance in indexing top/bottom points of Klines and indicators
Cov Threshold: Divergence intensity, which is less than 0. The smaller the intensity value, the more obvious divergence
Plot Bullish: Whether to draw regular bullish divergence label
Plot Hidden Bullish: Whether to draw hidden bullish divergence label
Plot Bearish: Whether to draw regular bearish divergence label
Plot Hidden Bearish: Whether to draw hidden bearish divergence label
Happy trading and enjoy your life!
————————————————————————————————————————
各位朋友大家好,很抱歉之前的开源版本因为规则原因被隐藏,我已经重新编辑了说明并重新发布
(1) 指标说明
该指标绘制于 K线 上,并在对应位置显示背离点以及背离程度
支持顶底位置 N 根K线的容差,由 Tolerant Kline Number 参数设置
支持背离强度的显示,即标签上显示的 REG/HID 值,该值小于 0,且越小说明背离程度越大
支持背离强度的过滤,由 Cov Threshold 参数设置, REG/HID 值大于这个值的背离会被忽略
标签中,REG 表示常规顶/低背离,而 HID 表示隐藏顶/底背离
标签中,SRC(x-y) 表示从当前第 x 根 bar 开始到第 y 跟 bar 出现背离
标签中,OSC(x-y) 表示从当前第 x 根 bar 所对应的指标开始到第 y 跟 bar 所对应的指标出现背离
(2) 参数说明
- RSI Settings
Source: 计算 RSI 指标的 source,默认为 close
RSI Length: 计算 RSI 指标的长度,默认为 14
- RSI Divergence
Pivot Lookback Right: 枢纽顶/底点往右回顾的 K线 bar 数量
Pivot Lookback Left: 枢纽顶/底点往左回顾的 K线 bar 数量
Max of Lookback Range: 回寻找枢纽顶/底点的最大回溯 K线 bar 数量
Min of Lookback Range: 回寻找枢纽顶/底点的最小回溯 K线 bar 数量
Tolerant Kline Number: K线和指标的顶/底点索引的最大误差
Cov Threshold: 背离程度,该值小于 0,且越小说明背离程度越大
Plot Bullish: 是否绘制常规底背离提示
Plot Hidden Bullish: 是否绘制隐藏底背离提示
Plot Bearish: 是否绘制常规顶背离提示
Plot Hidden Bearish: 是否绘制隐藏顶背离提示
祝大家交易愉快

+ Breadth & Volumenote* If you've used my "+ Rate of Change Indicator", I am updating that without the OBV, which has been moved here. Just an FYI.
This "indicator" is basically a variety of indicators that measure volume, or accumulation/distribution. There's a bit of a story about how this came about but
it's not that interesting, so I'll spare you.
Indicators from which you may choose here are On Balance Volume (OBV), Money Flow Index (MFI), Chaikin Money Flow (CMF), Chaikin Oscillator, and Positive & Negative Net Volume.
I'll give a brief overview of these below, and if you want to educate yourself further on them you may. There are many web resources for that.
Most people are probably familiar with OBV. It's one of the more commonly used volume indicators, especially in the crypto crowd (at least amongst those traders I follow). It's basically a cumulative (doesn't oscillate around a midpoint) momentum indicator that measures volume of the current period versus volume of the previous period and adds it if price closed higher, but subtracts it if price closes lower. It's another way of using volume to confirm trend.
The MFI is a momentum indicator that measures the flow of money into and out of an asset over some period of time (user input). It's calculated using the RSI, so it can be used similarly to RSI (divergences, overbought, oversold, etc.), but of course unlike the RSI it's calculated primarily using volume and comparing the most recent candle close to the previous one (similar to OBV).
CMF is a volume-weighted average of accumulation and distribution over a some period of time (typically 21). It's a way of measuring accumulation versus
distribution in an asset, and oscillates around a zero line. You would use it similarly to any other oscillator, in that you can look for divergences, and general positive or negative momentum.
Chaikin Oscillator is basically a MACD (without signal line) of the accumulation and distribution index (or line--which is somehow different than simply accumulation and distribution). I haven't looked into these differences deeply, but if you look below at the calculations, and substituted 'ad' for 'accdist' you get very different readings. I actually did that, and what it looks like it would do is turn the actual Oscillator into a MACD signal line. So, by substituting 'ad' for 'accdist' (or the accumulation/distribution index) you produce a signal line of the Chaikin Oscillator.
Anyway, all that confusion out of the way, as I said, it's a MACD on the accumulation and distribution index, therefore it is another zero line oscillator, and similarly to CMF, it's a way of measuring price movements in the chart versus a/d. The zero line isn't just any old zero line, however, it is actually the accumulation distribution line. I've made an OBV version of this by substituting the OBV for AD, so if you prefer OBV maybe you will like that.
Pos. & Neg Net Volume is actually an indicator I had seen made by RafaelZioni. It basically takes net volume, calculates a cumulative of that, then subtracts a moving average of some period from the cumulative net volume in order to create a volume oscillator. Use it like the other oscillators!
Added Donchian Channels, moving averages, Bollinger Bands, colored everything, and alerts.
Enjoy!
Below I will post images with the different indicators, everything on default settings (except for lookback period, which I have adjusted to my personal preferences).
Above is an image with the MFI being compared to the RSI since they are very similar (MFI being basically a volume derivative of the RSI).
Chaikin Money Flow set to lookback of 13. You could probably extend that a bit if you wanted to smooth the line more.
Chaikin Oscillator and Chaikin Oscillator of OBV, with a zoomed in look below, to see the differences more clearly.
CO and COBV closer look.
Positive & Negative Net Volume.

Penny Stock Short Signal Pro# Penny Stock Short Signal Pro (PSSP) v1.0
## Complete User Guide & Documentation
---
# 📋 TABLE OF CONTENTS
1. (#introduction)
2. (#why-short-penny-stocks)
3. (#the-7-core-detection-systems)
4. (#installation--setup)
5. (#understanding-the-dashboard)
6. (#input-settings-deep-dive)
7. (#visual-elements-explained)
8. (#alert-configuration)
9. (#trading-strategies)
10. (#risk-management)
11. (#best-practices)
12. (#troubleshooting)
13. (#changelog)
---
# Introduction
**Penny Stock Short Signal Pro (PSSP)** is a comprehensive Pine Script v6 indicator specifically engineered for identifying high-probability short-selling opportunities on low-priced, high-volatility stocks. Unlike generic indicators that apply broad technical analysis, PSSP is purpose-built for the unique characteristics of penny stock price action—where parabolic moves, retail FOMO, and violent reversals create predictable patterns for prepared traders.
## Key Features
- **7 Independent Detection Systems** working in concert to identify exhaustion points
- **Composite Signal Engine** that requires multiple confirmations before triggering
- **Real-Time Dashboard** displaying all signal states and market metrics
- **Automatic Risk Management** with dynamic stop-loss and profit target calculations
- **Customizable Sensitivity** for different trading styles (scalping vs. swing)
- **Built-in Alert System** for all major signal types
## Who Is This For?
- **Active Day Traders** looking to capitalize on intraday reversals
- **Short Sellers** who specialize in penny stocks and small caps
- **Momentum Traders** who want to identify when momentum is exhausting
- **Risk-Conscious Traders** who need clear entry/exit levels
---
# Why Short Penny Stocks?
## The Penny Stock Lifecycle
Penny stocks follow a remarkably predictable lifecycle that creates shorting opportunities:
```
PHASE 1: ACCUMULATION
└── Low volume, tight range
└── Smart money quietly building positions
PHASE 2: MARKUP / PROMOTION
└── News catalyst or promotional campaign
└── Volume increases, price begins rising
└── Early momentum traders enter
PHASE 3: DISTRIBUTION (YOUR OPPORTUNITY)
└── Parabolic move attracts retail FOMO buyers
└── Smart money selling into strength
└── Volume climax signals exhaustion
└── ⚠️ PSSP SIGNALS FIRE HERE ⚠️
PHASE 4: DECLINE
└── Support breaks, panic selling
└── Price returns toward origin
└── Short sellers profit
```
## Why Shorts Work on Penny Stocks
1. **No Fundamental Support**: Most penny stocks have no earnings, revenue, or assets to justify elevated prices
2. **Promotional Nature**: Many rallies are driven by promoters who will eventually stop
3. **Retail Exhaustion**: Retail buying power is finite—when it's exhausted, gravity takes over
4. **Float Dynamics**: Low float stocks move fast in both directions
5. **Technical Levels Matter**: VWAP, round numbers, and prior highs become self-fulfilling resistance
---
# The 7 Core Detection Systems
PSSP employs seven independent detection algorithms. Each identifies a specific type of exhaustion or reversal signal. When multiple systems fire simultaneously, the probability of a successful short dramatically increases.
---
## 1. PARABOLIC EXHAUSTION DETECTOR
### What It Detects
Identifies when price has moved too far, too fast and is likely to reverse. This system looks for the classic "blow-off top" pattern common in penny stock runners.
### Technical Logic
```
Parabolic Signal = TRUE when:
├── Consecutive green candles ≥ threshold (default: 3)
├── AND price extension from VWAP ≥ threshold ATRs (default: 1.5)
└── OR shooting star / upper wick rejection pattern forms
```
### Visual Representation
```
╱╲ ← Shooting star / upper wick
╱ ╲ (Parabolic exhaustion)
╱
╱
╱
══════════════ VWAP
╱
╱
```
### Why It Works on Penny Stocks
Penny stocks are notorious for parabolic moves driven by retail FOMO. When everyone who wants to buy has bought, there's no one left to push prices higher. The shooting star pattern shows that sellers are already stepping in at higher prices.
### Key Settings
| Parameter | Default | Range | Description |
|-----------|---------|-------|-------------|
| Lookback Period | 10 | 3-30 | Bars to analyze for pattern |
| Extension Threshold | 1.5 ATR | 0.5-5.0 | How far above VWAP is "parabolic" |
| Consecutive Green Bars | 3 | 2-10 | Minimum green bars for exhaustion |
---
## 2. VWAP REJECTION SYSTEM
### What It Detects
Volume Weighted Average Price (VWAP) is the single most important level for institutional traders. This system identifies when price tests above VWAP and gets rejected back below—a powerful short signal.
### Technical Logic
```
VWAP Rejection = TRUE when:
├── Candle high pierces above VWAP
├── AND candle closes below VWAP
├── AND candle is bearish (close < open)
└── AND rejection distance is within sensitivity threshold
```
### Visual Representation
```
High ──→ ╱╲
╱ ╲
VWAP ════════╱════╲═══════════
Close ←── Rejection
```
### Extended VWAP Signals
The system also tracks VWAP standard deviation bands. Rejection from the upper band (2 standard deviations above VWAP) is an even stronger signal.
### Why It Works on Penny Stocks
- Algorithms and institutions use VWAP as their benchmark
- Failed attempts to reclaim VWAP often lead to waterfall selling
- VWAP acts as a "magnet" that price tends to revert toward
### Key Settings
| Parameter | Default | Range | Description |
|-----------|---------|-------|-------------|
| Rejection Sensitivity | 0.5 ATR | 0.1-2.0 | How close to VWAP for valid rejection |
| Show VWAP Line | True | - | Display VWAP on chart |
| Show VWAP Bands | True | - | Display standard deviation bands |
| Band Multiplier | 2.0 | 0.5-4.0 | Standard deviations for bands |
---
## 3. VOLUME CLIMAX DETECTOR
### What It Detects
Identifies "blow-off tops" where extreme volume accompanies a price spike. This often marks the exact top as it represents maximum retail participation—after which buying power is exhausted.
### Technical Logic
```
Volume Climax = TRUE when:
├── Current volume ≥ (Average volume × Climax Multiple)
├── AND one of:
│ ├── Selling into the high (upper wick > lower wick on green bar)
│ └── OR post-climax weakness (red bar following climax bar)
```
### Visual Representation
```
Price: ╱╲
╱ ╲
╱ ╲
╱ ╲
╱
Volume:
▂▃▅▇██▇▅▃▂▁
↑
Volume Climax (3x+ average)
```
### Why It Works on Penny Stocks
- Retail traders pile in at the top, creating volume spikes
- Market makers and smart money use this liquidity to exit
- Once the volume spike passes, there's no fuel left for higher prices
- The "smart money selling into dumb money buying" creates the top
### Key Settings
| Parameter | Default | Range | Description |
|-----------|---------|-------|-------------|
| Volume MA Length | 20 | 5-50 | Period for average volume calculation |
| Climax Volume Multiple | 3.0x | 1.5-10.0 | Multiple of average for "climax" |
| Show Volume Bars | True | - | Visual volume representation |
---
## 4. RSI DIVERGENCE ANALYZER
### What It Detects
Bearish divergence occurs when price makes higher highs but RSI (momentum) makes lower highs. This indicates that momentum is weakening even as price pushes higher—a warning of imminent reversal.
### Technical Logic
```
Bearish Divergence = TRUE when:
├── RSI is in overbought territory (> threshold)
├── AND RSI is declining (current < previous < prior)
└── Indicates momentum exhaustion before price catches up
```
### Visual Representation
```
Price: /\ /\
/ \ / \ ← Higher high
/ \/
/
/
RSI: /\
/ \ /\
/ \/ \ ← Lower high (DIVERGENCE)
/ \
════════════════════ Overbought (70)
```
### Why It Works on Penny Stocks
- Penny stocks often push to new highs on weaker and weaker momentum
- Divergence signals that fewer buyers are participating at each new high
- Eventually, the lack of buying pressure leads to collapse
### Key Settings
| Parameter | Default | Range | Description |
|-----------|---------|-------|-------------|
| RSI Length | 14 | 5-30 | Standard RSI calculation period |
| Overbought Level | 70 | 60-90 | RSI level considered overbought |
| Divergence Lookback | 14 | 5-30 | Bars to look back for swing highs |
---
## 5. KEY LEVEL REJECTION TRACKER
### What It Detects
Identifies rejections from significant price levels where shorts are likely to be concentrated: High of Day (HOD), premarket highs, and psychological levels (whole and half dollars).
### Technical Logic
```
Level Rejection = TRUE when:
├── Price touches key level (within 0.2% tolerance)
├── AND candle is bearish (close < open)
├── AND close is in lower portion of candle range
│
├── Key Levels Tracked:
│ ├── High of Day (HOD)
│ ├── Premarket High
│ └── Psychological levels ($1.00, $1.50, $2.00, etc.)
```
### Visual Representation
```
HOD ─────────────────────────────────
╱╲ ← Rejection
╱ ╲
╱ ╲
╱
─────────────────────────────────
PM High ─────────────────────────────
```
### Why It Works on Penny Stocks
- **HOD**: The high of day is where the most traders are trapped long. Failure to break HOD often triggers stop-loss cascades
- **Premarket High**: Represents overnight enthusiasm; failure to exceed often means the "news" is priced in
- **Psychological Levels**: Round numbers ($1, $2, $5) attract orders and act as natural resistance
### Key Settings
| Parameter | Default | Range | Description |
|-----------|---------|-------|-------------|
| Track HOD Rejection | True | - | Monitor high of day |
| Track Premarket High | True | - | Monitor premarket resistance |
| Track Psychological Levels | True | - | Monitor round numbers |
---
## 6. FAILED BREAKOUT DETECTOR
### What It Detects
Identifies "bull traps" where price breaks above resistance but immediately fails and closes back below. This traps breakout buyers and often leads to accelerated selling.
### Technical Logic
```
Failed Breakout = TRUE when:
├── Price breaks above recent high (lookback period)
├── AND one of:
│ ├── Same bar closes below the breakout level
│ └── OR following bars show consecutive red candles
```
### Visual Representation
```
╱╲
╱ ╲ ← False breakout
Recent High ══╱════╲════════════════
╱ ╲
╱ ╲
╱ ╲ ← Trapped longs panic sell
```
### Why It Works on Penny Stocks
- Breakout traders enter on the break, providing exit liquidity for smart money
- When the breakout fails, these traders become trapped and must exit
- Their forced selling accelerates the decline
- Penny stocks have thin order books, making failed breakouts especially violent
### Key Settings
| Parameter | Default | Range | Description |
|-----------|---------|-------|-------------|
| Breakout Lookback | 5 | 2-15 | Bars to define "recent high" |
| Confirmation Bars | 2 | 1-5 | Bars to confirm failure |
---
## 7. MOVING AVERAGE BREAKDOWN SYSTEM
### What It Detects
Monitors exponential moving averages (EMAs) for bearish crossovers and price rejections. EMA crosses often signal trend changes, while rejections from EMAs indicate resistance.
### Technical Logic
```
MA Breakdown = TRUE when:
├── Bearish EMA cross (fast crosses below slow)
└── OR EMA rejection (price tests EMA from below and fails)
```
### Visual Representation
```
╱╲ ← Rejection from EMA
╱ ╲
EMA 9 ═══════════╱════╲═══════════
╲
EMA 20 ═══════════════════╲════════
╲
Bearish cross ↓
```
### Why It Works on Penny Stocks
- EMAs smooth out the noise and show underlying trend direction
- When fast EMA crosses below slow EMA, it signals momentum shift
- Rejected attempts to reclaim EMAs show sellers are in control
### Key Settings
| Parameter | Default | Range | Description |
|-----------|---------|-------|-------------|
| Fast EMA | 9 | 3-20 | Short-term trend |
| Slow EMA | 20 | 10-50 | Medium-term trend |
| Show EMAs | True | - | Display on chart |
---
# Installation & Setup
## Step 1: Access Pine Editor
1. Open TradingView (tradingview.com)
2. Open any chart
3. Click "Pine Editor" at the bottom of the screen
## Step 2: Create New Indicator
1. Click "Open" → "New blank indicator"
2. Delete any existing code
3. Paste the entire PSSP code
## Step 3: Save and Add to Chart
1. Click "Save" (give it a name like "PSSP")
2. Click "Add to chart"
3. The indicator will appear with default settings
## Step 4: Configure Settings
1. Click the gear icon (⚙️) on the indicator
2. Adjust settings based on your trading style (see Settings section)
3. Click "OK" to apply
## Recommended Chart Setup
- **Timeframe**: 1-minute or 5-minute for scalping, 15-minute for swing shorts
- **Chart Type**: Candlestick
- **Extended Hours**: Enable if trading premarket/afterhours
- **Volume**: Can disable default volume since PSSP tracks it
---
# Understanding the Dashboard
The real-time dashboard provides at-a-glance status of all systems:
```
┌─────────────────────────────────────────┐
│ 📊 SHORT SIGNAL DASHBOARD │
├─────────────────────────────────────────┤
│ Signal Strength: 5/7 │
├─────────────────────────────────────────┤
│ ─── ACTIVE SIGNALS ─── │
│ │
│ Parabolic Exhaustion 🔴 2.1 ATR │
│ VWAP Rejection 🔴 Above │
│ Volume Climax 🔴 4.2x Avg │
│ RSI Divergence ⚪ RSI: 68 │
│ Level Rejection 🔴 @ HOD │
│ Failed Breakout 🔴 │
│ MA Breakdown ⚪ Bullish │
├─────────────────────────────────────────┤
│ ─── RISK LEVELS ─── │
│ Stop: $2.45 T1: $2.10 T2: $1.85 │
└─────────────────────────────────────────┘
```
## Dashboard Elements Explained
### Signal Strength Indicator
| Rating | Signals | Color | Interpretation |
|--------|---------|-------|----------------|
| STRONG | 5-7 | Red | High-confidence short opportunity |
| MODERATE | 3-4 | Orange | Decent setup, consider other factors |
| WEAK | 1-2 | Gray | Insufficient confirmation |
| NONE | 0 | Gray | No short signals active |
### Signal Status Icons
- 🔴 = Signal is ACTIVE (condition met)
- ⚪ = Signal is INACTIVE (condition not met)
### Contextual Metrics
Each signal row includes relevant metrics:
- **Parabolic**: Shows ATR extension from VWAP
- **VWAP**: Shows if price is Above/Below VWAP
- **Volume**: Shows current volume as multiple of average
- **RSI**: Shows current RSI value
- **Level**: Shows which level was touched (HOD, PM High, etc.)
- **MA**: Shows EMA relationship (Bullish/Bearish)
### Risk Levels
When a composite short signal fires:
- **Stop**: Suggested stop-loss level (high + ATR multiple)
- **T1**: First profit target (1:1 risk/reward)
- **T2**: Second profit target (user-defined R:R)
---
# Input Settings Deep Dive
## Group 1: Parabolic Exhaustion
| Setting | Default | Conservative | Aggressive | Description |
|---------|---------|--------------|------------|-------------|
| Enable | True | True | True | Turn system on/off |
| Lookback Period | 10 | 15 | 5 | Bars analyzed for pattern |
| Extension Threshold | 1.5 | 2.0 | 1.0 | ATRs above VWAP for "parabolic" |
| Consecutive Green Bars | 3 | 4 | 2 | Minimum green bars required |
**Tuning Tips:**
- Lower thresholds = more signals but more false positives
- Higher thresholds = fewer signals but higher quality
- For very volatile penny stocks, consider higher thresholds
## Group 2: VWAP Rejection
| Setting | Default | Conservative | Aggressive | Description |
|---------|---------|--------------|------------|-------------|
| Enable | True | True | True | Turn system on/off |
| Rejection Sensitivity | 0.5 | 0.3 | 0.8 | ATR distance for valid rejection |
| Show VWAP Line | True | True | True | Display VWAP |
| Show VWAP Bands | True | True | True | Display deviation bands |
| Band Multiplier | 2.0 | 2.5 | 1.5 | Standard deviations for bands |
**Tuning Tips:**
- Tighter sensitivity (lower number) = must reject very close to VWAP
- Wider bands = less frequent upper band rejections but more significant
## Group 3: Volume Climax
| Setting | Default | Conservative | Aggressive | Description |
|---------|---------|--------------|------------|-------------|
| Enable | True | True | True | Turn system on/off |
| Volume MA Length | 20 | 30 | 10 | Baseline volume period |
| Climax Volume Multiple | 3.0 | 4.0 | 2.0 | Multiple for "climax" status |
| Show Volume Profile | True | True | True | Visual volume bars |
**Tuning Tips:**
- Higher multiple = only extreme volume spikes trigger
- Shorter MA = more responsive to recent volume changes
- For highly liquid stocks, consider higher multiples
## Group 4: Momentum Divergence
| Setting | Default | Conservative | Aggressive | Description |
|---------|---------|--------------|------------|-------------|
| Enable | True | True | True | Turn system on/off |
| RSI Length | 14 | 21 | 7 | RSI calculation period |
| Overbought Level | 70 | 75 | 65 | Threshold for "overbought" |
| Divergence Lookback | 14 | 20 | 10 | Bars for swing high detection |
**Tuning Tips:**
- Lower overbought threshold = more frequent signals
- Shorter RSI length = more responsive but noisier
## Group 5: Key Level Rejection
| Setting | Default | Description |
|---------|---------|-------------|
| Enable | True | Master toggle for level system |
| Track Premarket High | True | Monitor premarket resistance |
| Track HOD Rejection | True | Monitor high of day |
| Track Psychological Levels | True | Monitor round numbers |
**Tuning Tips:**
- Disable premarket tracking if stock doesn't have significant premarket activity
- Psychological levels work best on stocks under $10
## Group 6: Failed Follow-Through
| Setting | Default | Conservative | Aggressive | Description |
|---------|---------|--------------|------------|-------------|
| Enable | True | True | True | Turn system on/off |
| Breakout Lookback | 5 | 8 | 3 | Bars defining "recent high" |
| Confirmation Bars | 2 | 3 | 1 | Bars to confirm failure |
**Tuning Tips:**
- Shorter lookback = more breakouts detected but smaller significance
- More confirmation bars = higher confidence but later entry
## Group 7: Moving Average Signals
| Setting | Default | Conservative | Aggressive | Description |
|---------|---------|--------------|------------|-------------|
| Enable | True | True | True | Turn system on/off |
| Fast EMA | 9 | 12 | 5 | Short-term trend |
| Slow EMA | 20 | 26 | 13 | Medium-term trend |
| Show EMAs | True | True | True | Display on chart |
**Tuning Tips:**
- Standard 9/20 works well for most penny stocks
- Faster EMAs (5/13) for scalping, slower (12/26) for swing trading
## Group 8: Composite Signal
| Setting | Default | Conservative | Aggressive | Description |
|---------|---------|--------------|------------|-------------|
| Minimum Signals | 3 | 4-5 | 2 | Signals needed for trigger |
| Show Dashboard | True | True | True | Display signal table |
| Dashboard Position | top_right | - | - | Screen location |
**Tuning Tips:**
- **Minimum Signals is the most important setting**
- Higher minimum = fewer trades but higher win rate
- Lower minimum = more trades but more false signals
## Group 9: Risk Management
| Setting | Default | Conservative | Aggressive | Description |
|---------|---------|--------------|------------|-------------|
| Show Stop Levels | True | True | True | Display stop loss |
| Stop ATR Multiple | 1.5 | 2.0 | 1.0 | Stop distance in ATRs |
| Show Targets | True | True | True | Display profit targets |
| Target R:R | 2.0 | 1.5 | 3.0 | Risk:Reward for Target 2 |
**Tuning Tips:**
- Tighter stops (lower ATR multiple) = less risk but more stop-outs
- Higher R:R targets = bigger winners but fewer targets hit
## Group 10: Visual Settings
| Setting | Default | Description |
|---------|---------|-------------|
| Bullish Color | Green | Color for bullish elements |
| Bearish Color | Red | Color for bearish/short signals |
| Warning Color | Orange | Color for caution signals |
| Neutral Color | Gray | Color for inactive elements |
---
# Visual Elements Explained
## Chart Overlays
### VWAP Line (Blue)
- **Solid blue line** = Volume Weighted Average Price
- Price above VWAP = bullish bias
- Price below VWAP = bearish bias
- **Use**: Short when price rejects from above VWAP
### VWAP Bands (Purple circles)
- Upper band = 2 standard deviations above VWAP
- Lower band = 2 standard deviations below VWAP
- **Use**: Extreme extension to upper band signals potential reversal
### EMAs (Orange and Red)
- **Orange line** = Fast EMA (9-period default)
- **Red line** = Slow EMA (20-period default)
- **Use**: Bearish cross or price rejection from EMAs confirms short
### HOD Line (Red, dashed)
- Shows the current day's high
- **Use**: Rejection from HOD is a key short signal
### Premarket High (Orange, dashed)
- Shows premarket session high
- **Use**: Failure to break PM high often signals weakness
## Signal Markers
### Individual Signal Markers (Small)
| Shape | Color | Signal |
|-------|-------|--------|
| ▼ Triangle | Purple | Parabolic Exhaustion |
| ✕ X-Cross | Blue | VWAP Rejection |
| ◆ Diamond | Yellow | Volume Climax |
| ● Circle | Orange | RSI Divergence |
| ■ Square | Red | Failed Breakout |
### Composite Short Signal (Large)
- **Large red triangle** with "SHORT" text
- Only appears when minimum signal threshold is met
- This is your primary trading signal
## Risk Level Lines
### Stop Loss (Red line)
- Calculated as: Entry + (ATR × Stop Multiple)
- Represents maximum acceptable loss
- **RESPECT THIS LEVEL**
### Target 1 (Light green line)
- First profit target at 1:1 risk/reward
- Consider taking partial profits here
### Target 2 (Dark green line)
- Second profit target at user-defined R:R
- Let winners run to this level
## Background Coloring
### Light Red Background
- Appears when composite short signal is active
- Indicates you should be looking for shorts, not longs
### Light Purple Background
- Appears during extreme parabolic extension
- Warning of potential imminent reversal
---
# Alert Configuration
## Available Alerts
### 1. Composite Short Signal
**Best for**: Primary trading signal
```
Condition: Composite short signal fires
Message: "PSSP: Short Signal Triggered - {ticker} at {close}"
```
### 2. Parabolic Exhaustion
**Best for**: Early warning of potential top
```
Condition: Parabolic exhaustion detected
Message: "PSSP: Parabolic exhaustion detected on {ticker}"
```
### 3. Volume Climax
**Best for**: Blow-off top identification
```
Condition: Volume climax occurs
Message: "PSSP: Volume climax / blow-off top on {ticker}"
```
### 4. Strong Short Setup (5+ Signals)
**Best for**: High-confidence opportunities only
```
Condition: 5 or more signals active
Message: "PSSP: STRONG short setup on {ticker}"
```
### 5. Very Strong Short Setup (6+ Signals)
**Best for**: Maximum confidence trades
```
Condition: 6 or more signals active
Message: "PSSP: VERY STRONG short setup on {ticker}"
```
### 6. Failed Breakout
**Best for**: Bull trap identification
```
Condition: Failed breakout detected
Message: "PSSP: Failed breakout detected on {ticker}"
```
### 7. Key Level Rejection
**Best for**: Resistance level plays
```
Condition: Key level rejection occurs
Message: "PSSP: Key level rejection on {ticker}"
```
## Setting Up Alerts in TradingView
1. Right-click on the chart
2. Select "Add Alert"
3. Set Condition to "Penny Stock Short Signal Pro"
4. Choose your desired alert condition
5. Configure notification method (popup, email, webhook, etc.)
6. Set expiration (or "Open-ended" for permanent)
7. Click "Create"
## Alert Strategy Recommendations
### For Active Day Traders
- Enable: Composite Short Signal, Volume Climax
- Set to: Popup + Sound
- Check frequently during market hours
### For Swing Traders
- Enable: Strong Short Setup (5+), Very Strong Short Setup (6+)
- Set to: Email + Mobile Push
- Review at key times (open, lunch, close)
### For Part-Time Traders
- Enable: Very Strong Short Setup (6+) only
- Set to: Email + SMS
- Only trade highest-conviction setups
---
# Trading Strategies
## Strategy 1: The Parabolic Fade
**Setup Requirements:**
- Parabolic Exhaustion signal ACTIVE
- Extension from VWAP ≥ 2.0 ATR
- Volume climax or declining volume on push
**Entry:**
- Short on first red candle after signal
- Or short on break below prior candle's low
**Stop Loss:**
- Above the high of the parabolic move
- Maximum: 1.5 ATR above entry
**Targets:**
- T1: VWAP (take 50% off)
- T2: Lower VWAP band or LOD
**Best Time:** 9:30-10:30 AM (morning runners)
---
## Strategy 2: VWAP Rejection Short
**Setup Requirements:**
- VWAP Rejection signal ACTIVE
- Price came from below VWAP
- Rejection candle has significant upper wick
**Entry:**
- Short on close below VWAP
- Or short on break below rejection candle low
**Stop Loss:**
- Above VWAP + 0.5 ATR
- Or above rejection candle high
**Targets:**
- T1: Lower VWAP band
- T2: Prior support or LOD
**Best Time:** Midday (11:00 AM - 2:00 PM)
---
## Strategy 3: HOD Failure Short
**Setup Requirements:**
- Level Rejection signal ACTIVE (HOD)
- Multiple tests of HOD without breakthrough
- Volume declining on each test
**Entry:**
- Short on confirmed HOD rejection
- Wait for close below the rejection candle
**Stop Loss:**
- Above HOD + 0.25 ATR (tight)
- Clear invalidation if HOD breaks
**Targets:**
- T1: VWAP
- T2: Morning support levels
**Best Time:** 10:30 AM - 12:00 PM
---
## Strategy 4: Volume Climax Fade
**Setup Requirements:**
- Volume Climax signal ACTIVE
- Volume ≥ 3x average on green candle
- Followed by bearish candle or upper wick
**Entry:**
- Short on first red candle after climax
- Or short on break below climax candle low
**Stop Loss:**
- Above climax candle high
- Give room for volatility spike
**Targets:**
- T1: 50% retracement of the run
- T2: VWAP or start of the run
**Best Time:** First hour of trading
---
## Strategy 5: The Full Composite (High Conviction)
**Setup Requirements:**
- Composite Short signal ACTIVE
- Minimum 4-5 individual signals
- Clear visual of signal markers clustering
**Entry:**
- Short immediately on composite signal
- Use market order for fast-moving stocks
**Stop Loss:**
- Use indicator's automatic stop level
- Do not deviate from system
**Targets:**
- T1: Indicator's T1 level (1:1)
- T2: Indicator's T2 level (2:1)
**Best Time:** Any time with sufficient signals
---
# Risk Management
## Position Sizing Formula
```
Position Size = (Account Risk %) / (Stop Loss %)
Example:
- Account: $25,000
- Risk per trade: 1% = $250
- Entry: $2.00
- Stop: $2.20 (10% stop)
- Position Size: $250 / 10% = $2,500 worth
- Shares: $2,500 / $2.00 = 1,250 shares
```
## Risk Rules
### The 1% Rule
Never risk more than 1% of your account on any single trade. For a $25,000 account, max risk = $250.
### The 2x Stop Rule
If your stop gets hit twice on the same stock, stop trading it for the day. The pattern isn't working.
### The Daily Loss Limit
Set a maximum daily loss (e.g., 3% of account). Stop trading if hit.
### The Size-Down Rule
After a losing trade, reduce your next position size by 50%. Rebuild after a winner.
## Short-Specific Risks
### The Short Squeeze
- Penny stocks can squeeze violently
- ALWAYS use stops
- Never "hope" a position comes back
- Size appropriately for volatility
### The Hard-to-Borrow
- Check borrow availability before trading
- High borrow fees eat into profits
- Some stocks become HTB mid-trade
### The Halt Risk
- Penny stocks can halt on volatility
- Position size for worst-case halt against you
- Halts can open significantly higher
---
# Best Practices
## DO's
✅ **Wait for multiple signals** - Single signals have lower accuracy
✅ **Trade with the trend** - Short when daily trend is down
✅ **Use the dashboard** - Check signal count before entering
✅ **Respect stops** - The indicator calculates them for a reason
✅ **Size appropriately** - Penny stocks are volatile; position small
✅ **Trade liquid stocks** - Volume ≥ 500K daily average
✅ **Know the catalyst** - Understand why the stock is moving
✅ **Take partial profits** - Secure gains at T1
✅ **Journal your trades** - Track what works and what doesn't
✅ **Time your entries** - Best shorts often come 10:30-11:30 AM
## DON'Ts
❌ **Don't short strong stocks** - If it won't go down, don't force it
❌ **Don't fight the tape** - A stock going up can keep going up
❌ **Don't average up on losers** - Adding to losing shorts is dangerous
❌ **Don't ignore the dashboard** - It exists to help you
❌ **Don't overtrade** - Quality over quantity
❌ **Don't short into news** - Wait for the reaction first
❌ **Don't trade the first 5 minutes** - Too chaotic for reliable signals
❌ **Don't hold overnight** - Penny stock gaps can destroy accounts
❌ **Don't trade without stops** - Ever.
❌ **Don't trade on tilt** - After losses, take a break
## Optimal Trading Windows
| Time (ET) | Quality | Notes |
|-----------|---------|-------|
| 9:30-9:35 | ⭐ | Too volatile, avoid |
| 9:35-10:30 | ⭐⭐⭐⭐⭐ | Best shorts, morning runners exhaust |
| 10:30-11:30 | ⭐⭐⭐⭐ | Secondary exhaustion, HOD rejections |
| 11:30-2:00 | ⭐⭐ | Midday lull, lower quality |
| 2:00-3:00 | ⭐⭐⭐ | Afternoon setups develop |
| 3:00-3:30 | ⭐⭐⭐⭐ | End of day momentum |
| 3:30-4:00 | ⭐⭐ | Closing volatility, risky |
---
# Troubleshooting
## Common Issues
### "Signals aren't appearing"
- Check that the relevant system is enabled in settings
- Ensure minimum signals threshold isn't too high
- Verify the stock has sufficient volume for calculations
### "Too many false signals"
- Increase minimum signals threshold
- Use more conservative settings (see Settings section)
- Focus on stocks with cleaner price action
### "Dashboard not showing"
- Ensure "Show Signal Dashboard" is enabled
- Check that your chart has enough space
- Try a different dashboard position
### "VWAP line is missing"
- VWAP requires intraday timeframes (1m, 5m, 15m, etc.)
- VWAP resets daily; won't show on daily+ charts
- Ensure "Show VWAP Line" is enabled
### "Stop loss seems too tight/wide"
- Adjust Stop ATR Multiple in Risk Management settings
- Lower multiple = tighter stop
- Higher multiple = wider stop
### "Alerts not triggering"
- Verify alert is set to the correct indicator
- Check that alert hasn't expired
- Ensure notification settings are configured in TradingView
## Performance Optimization
If the indicator is slow:
1. Reduce the number of visual elements shown
2. Disable unused signal systems
3. Use on fewer simultaneous charts
4. Close unused browser tabs
---
# Changelog
## Version 1.0 (Initial Release)
- 7 core detection systems implemented
- Real-time signal dashboard
- Automatic risk management calculations
- 7 alert conditions
- Full visual overlay system
- Comprehensive input settings
## Planned Features (Future Updates)
- Scanner integration for multi-stock screening
- Machine learning signal weighting
- Backtesting statistics panel
- Volume profile analysis
- Level 2 data integration (if available)
- Custom timeframe VWAP options
---
# Support & Feedback
## Reporting Issues
When reporting issues, please include:
1. TradingView username
2. Stock symbol and timeframe
3. Screenshot of the issue
4. Your indicator settings
5. Steps to reproduce
## Feature Requests
We welcome suggestions for improving PSSP. Consider:
- What specific pattern are you trying to catch?
- How would this help your trading?
- Any reference examples?
---
# Disclaimer
**IMPORTANT: This indicator is for educational and informational purposes only.**
- Past performance does not guarantee future results
- Short selling carries unlimited risk potential
- Always use proper position sizing and stop losses
- Paper trade before using real capital
- The creator assumes no liability for trading losses
- Consult a financial advisor before trading
**Trade at your own risk.**
---
*Penny Stock Short Signal Pro v1.0*
*Pine Script v6*
*© 2025*

Multi Length Market Structure (BoS + ChoCh)█ OVERVIEW
The "Multi Length Market Structure (BoS + ChoCh)" indicator is a technical analysis tool that identifies key pivot points on the chart and signals market structure breaks (Break of Structure - BoS) and changes in market character (Change of Character - ChoCh). It is designed for traders employing market structure-based strategies, enabling the identification of critical support and resistance levels and potential trend reversal points. The indicator offers flexible pivot length settings, customizable colors, and labels, ensuring clarity and precision on the chart.
█ CONCEPTS
The indicator was developed to simplify the identification of changes in market structure, catering to both short-term and longer-term trading strategies. To this end, it simultaneously displays breakouts for four editable pivot lengths. The lengths represent the delay, measured in the number of candles, after which a pivot is recognized. Pivots with larger values are often turning points on higher timeframes, providing a broader view of the market.
Why are BoS and ChoCh important? A Break of Structure (BoS) indicates trend continuation when the price breaks a key level (e.g., a previous high or low). A Change of Character (ChoCh) signals a potential trend reversal when the price breaks a level in the opposite direction of the prior trend. These signals help traders identify moments when the market changes its dynamics, which is crucial for price action strategies.
█ FEATURES
- Pivot Detection: Identifies pivot points (highs and lows) based on four different pivot lengths (default: 5, 10, 15, 20), enabling market structure analysis with varying sensitivity.
- BoS and ChoCh Signals: Generates Break of Structure (BoS) signals in the form of triangles (green for bullish, red for bearish) and Change of Character (ChoCh) signals when the price breaks a key level in the opposite direction of the prior trend.
- Pivot Labels: Displays labels for highs (HH - Higher High, LH - Lower High) and lows (HL - Higher Low, LL - Lower Low) with the option to select which pivot to display them for.
- Customizable Colors and Styles: Allows configuration of colors for BoS and ChoCh signals and pivot labels.
- Alerts: Built-in alerts for BoS and ChoCh signals for each pivot length, including price and signal type descriptions.
█ HOW TO USE
Adding to the Chart: Add the indicator to your TradingView chart via the Pine Editor or Indicators menu.
Configuring Settings:
- Pivot Lengths: Set four different pivot lengths (Pivot Length 1-4, default: 5, 10, 15, 20) to adjust the sensitivity of pivot detection. Shorter lengths are more sensitive, while longer lengths are more significant. If you want to use only one length, set all pivot lengths to the same value.
- Colors and Styles: Configure colors for BoS signals (green for bullish, red for bearish) and pivot labels.
- Labels: Enable/disable the display of HH/HL/LH/LL labels and choose which pivot to display them for (Pivot 1-4 or none).
- Signals: BoS and ChoCh signals are displayed as triangles (upward for bullish BoS, downward for bearish). Alerts can be configured for each signal type.
Interpreting Signals:
- Bullish BoS Signal: A green triangle below the candle indicates a breakout above a previous high, suggesting bullish trend continuation.
- Bearish BoS Signal: A red triangle above the candle indicates a breakout below a previous low, suggesting bearish trend continuation.
- Bullish ChoCh Signal: A green triangle after breaking a high in a downtrend indicates a potential reversal to bullish.
- Bearish ChoCh Signal: A red triangle after breaking a low in an uptrend indicates a potential reversal to bearish.
- Pivot Levels: Use pivot points as dynamic support and resistance levels. Levels from longer pivots carry greater significance.
Combine signals with other technical analysis tools, such as RSI (to identify overbought/oversold conditions) or MACD (to confirm momentum). Analyze market structure on higher timeframes for stronger signals. Be particularly cautious when entering positions if RSI approaches overbought/oversold zones and divergences appear, as this may indicate a trend change.
█ APPLICATIONS
- Breakout Strategies: Trade based on BoS signals indicating trend continuation. A BoS signal after breaking a high in an uptrend may suggest a strong bullish impulse, especially when supported by a rising MACD.
- Reversal Strategies: ChoCh signals may indicate a potential trend reversal, particularly when confirmed by other indicators, such as RSI divergences or Fibonacci levels.

icreature RSI Divergence + OB/OSThis script simply showing all divergences and fill in colours when ob or os . Enjoy!
RSI and Smoothed RSI Bull Div Strategy [BigBitsIO]This strategy focuses on finding a low RSI value, then targeting a low Smoothed RSI value while the price is below the low RSI in the lookback period to trigger a buy signal.
Features Take Profit, Stop Loss, and Plot Target inputs. As well as many inputs to manage how the RSI and Smoothed RSI are configured within the strategy.
Explanation of all the inputs
Take Profit %: % change in price from position entry where strategy takes profit
Stop Loss %: % change in price from position entry where strategy stops losses
RSI Lookback Period: # of candles used to calculate RSI
Buy Below Lowest Low In RSI Divergence Lookback Target %: % change in price from lowest RSI candle in divergence lookback if set
Source of Buy Below Target Price: Source of price (close, open, high, low, etc..) used to calculated buy below %
Smoothed RSI Lookback Period: # of candles used to calculate RSI
RSI Currently Below: Value the current RSI must be below to trigger a buy
RSI Divergence Lookback Period: # of candles used to lookback for lowest RSI in the divergence lookback period
RSI Lowest In Divergence Lookback Currently Below: Require the lowest RSI in the divergence lookback to be below this value
RSI Sell Above: If take profit or stop loss is not hit, the position will sell when RSI rises above this value
Minimum SRSI Downtrend Length: Require that the downtrend length of the SRSI be this value or higher to trigger a buy
Smoothed RSI Currently Below: Value the current SRSI must be below to trigger a buy

Trade Manager + DivergenceTrade Manager + Divergence — Smart Entry & Automated Risk Control
Trade Manager + Divergence is a versatile trading strategy that combines automated RSI divergence detection, manual level entries, and a multi‑layered safety‑order system with advanced risk management.
It is designed for traders who want precise technical entries supported by fully automated position handling.
🔍 Key Features
1. RSI Divergence Entry Module
The strategy automatically detects:
Bullish divergence (Higher Low on RSI + Lower Low on price)
Bearish divergence (Lower High on RSI + Higher High on price)
Additional options include:
Divergence strength filtering
MA200 trend filter
Visual divergence markers on the chart
2. Manual Entry Levels
You can define:
A manual LONG entry price
A manual SHORT entry price
Automatic removal of the level after entry
Perfect for traders who prefer to work from key zones they identify themselves.
3. Multi‑Level Safety Order System
The strategy supports:
Initial base order
Up to 8 safety orders
Volume scaling
Step scaling
All parameters are fully customizable:
Order size
Distance between orders
Scaling coefficients
Maximum number of safety orders
4. Automated Take Profit
Take profit is calculated from the average position price:
Separate TP settings for LONG and SHORT
TP levels displayed directly on the chart
5. Breakeven Mechanism
After a specified number of safety orders, the strategy can:
Automatically close the position at breakeven
Include exchange fees in the calculation
6. Mini Status Panel
A compact table in the top‑right corner shows:
Position size
Position value
Number of open trades
Current PnL
Equity
This makes monitoring your position simple and intuitive.
⚙️ Clean and Organized Settings
All inputs are grouped into clear sections:
General
Entry Mode
Divergence Settings
Manual Levels
Risk Management
Each parameter includes a tooltip explaining its purpose.
📌 Disclaimer
This script does not guarantee profits and is not financial advice.
Always test strategies on historical data and use proper risk management.

Eclipse Multi-Oscillator [JOAT]Eclipse Multi-Oscillator - Unified Momentum Confluence System
Introduction and Purpose
Eclipse Multi-Oscillator is an open-source indicator that combines four classic oscillators (RSI, Stochastic, CCI, and Williams %R) into a single unified view with confluence detection. The core problem this indicator solves is oscillator disagreement: traders often see RSI oversold while Stochastic is neutral, or CCI overbought while Williams %R is mid-range. This creates confusion about the true momentum state.
This indicator addresses that by displaying all four oscillators together and counting how many agree on overbought or oversold conditions, providing a clear confluence score that cuts through the noise.
Why These Four Oscillators Work Together
Each oscillator measures momentum differently, and their combination provides a more complete picture:
1. RSI (Relative Strength Index) - Measures the magnitude of recent price changes. Best at identifying momentum exhaustion.
2. Stochastic - Compares closing price to the high-low range. Best at identifying where price is within its recent range.
3. CCI (Commodity Channel Index) - Measures price deviation from statistical mean. Best at identifying unusual price movements.
4. Williams %R - Similar to Stochastic but inverted. Provides confirmation of Stochastic readings.
When 3 or more of these oscillators agree on overbought or oversold, the signal is significantly more reliable than any single oscillator alone.
How Confluence Scoring Works
The indicator counts how many oscillators are in extreme territory:
int obCount = 0
if rsi > rsiOB
obCount += 1
if stochK > stochOB
obCount += 1
if cci > cciOB
obCount += 1
if willRScaled > stochOB
obCount += 1
bool strongOverbought = obCount >= 3
bool strongOversold = osCount >= 3
The confluence score ranges from -4 (all oversold) to +4 (all overbought), with 0 being neutral.
Signal Types
Strong Oversold - 3+ oscillators below oversold threshold (potential bounce)
Strong Overbought - 3+ oscillators above overbought threshold (potential pullback)
OB/OS Exit - RSI leaving extreme zone with Stochastic confirmation (potential reversal)
Divergence - Price makes new high/low while RSI does not (potential reversal warning)
Dashboard Information
RSI/Stoch K/CCI/Will %R - Current values with zone status (OB/OS/MID)
Confluence - Overall bias (STRONG OS, STRONG OB, Lean Bull/Bear, Neutral)
OB Count - How many oscillators are overbought (0-4)
OS Count - How many oscillators are oversold (0-4)
How to Use This Indicator
For Reversal Trading:
1. Wait for Strong Oversold (3+ oscillators agree)
2. Look for bullish candlestick pattern or support level
3. Enter long with stop below recent low
4. Take profit when confluence returns to neutral or overbought
For Trend Confirmation:
1. Check confluence direction matches your trade bias
2. Avoid longs when confluence is strongly overbought
3. Avoid shorts when confluence is strongly oversold
For Divergence Trading:
1. Watch for "D" labels indicating RSI divergence
2. Bullish divergence at support = potential long
3. Bearish divergence at resistance = potential short
Input Parameters
RSI Length (14) - Period for RSI calculation
Stochastic K/D Length (14/3) - Periods for Stochastic
CCI Length (20) - Period for CCI
Williams %R Length (14) - Period for Williams %R
OB/OS Thresholds - Customizable levels for each oscillator
Timeframe Recommendations
15m-1H: Good for intraday momentum analysis
4H-Daily: Best for swing trading confluence
Very short timeframes may produce noisy signals
Limitations
All oscillators can remain in extreme territory during strong trends
Confluence does not predict direction, only identifies extremes
Divergence detection is simplified and may miss some patterns
Works best in ranging or moderately trending markets
Open-Source and Disclaimer
This script is published as open-source under the Mozilla Public License 2.0 for educational purposes. The source code is fully visible and can be studied.
This indicator does not constitute financial advice. Oscillator confluence does not guarantee reversals. Past performance does not guarantee future results. Always use proper risk management.
- Made with passion by officialjackofalltrades

Victoria RSI Hybrid Pro – Momentum + Volume + DivergenceConditions and Actions:
RSI > 50 → Bullish regime → Consider Calls
RSI < 50 → Bearish regime → Consider Puts
RSI crosses up → Momentum shift up → Buy confirmation
RSI crosses down → Momentum shift down → Sell confirmation
RSI > 70 → Overbought → Take profits
RSI < 30 → Oversold → Watch for reversal
Bullish divergence → Hidden upward momentum → Reversal watch
Bearish divergence → Hidden downward momentum → Reversal watch
4. Multi-Indicator Confirmation Rules
Combine signals from EMA, SMA, RSI, and Volume to identify high-confidence trades.
Rules:
Triple Green → EMA1>SMA3, RSI>50, Volume Up → Buy Calls / Shares
Triple Red → EMA1 70 + Weak Volume → Exit Calls early
EMA1 flips direction + Strong Volume → Confirm bias immediately
RSI on 1H agrees with main chart → Trend continuation likely
6. Timeframes
Scalps: 1m–5m
Next-Day Options: 15m–1H
Swings: 4H–1D
7. Key Mindset Rules
Patience beats prediction. Wait for confirmations.
Volume confirms conviction, not direction.
If RSI and Overlay disagree → No trade.
Only act when 2 of 3 systems (EMA, RSI, Volume) align.

Adaptive Volume-Weighted RSI (AVW-RSI)Concept Summary
The AVW-RSI is a modified version of the Relative Strength Index (RSI), where each price change is weighted by the relative trading volume for that period. This means periods of high volume (typically driven by institutions or “big money”) have a greater influence on the RSI calculation than periods of low volume.
Why AVW-RSI Helps Traders
Avoids Weak Signals During Low Volume
Standard RSI may show overbought/oversold zones even during low-volume periods (e.g., during lunch hours or after news).
AVW-RSI gives less weight to these periods, avoiding misleading signals.
Amplifies Strong Momentum Moves
If RSI is rising during high volume, it's more likely driven by institutional buying—AVW-RSI reflects that stronger by weighting the RSI component.
Filters Out Retail Noise
By prioritizing high-volume candles, it naturally discounts fakeouts caused by thin markets or retail-heavy moves.
Highlights Institutional Entry/Exit
Useful for spotting hidden accumulation/distribution that classic RSI would miss.
How It Works (Calculation Logic)
Traditional RSI Formula Recap
RSI = 100 - (100 / (1 + RS))
RS = Average Gain / Average Loss (over N periods)
Modified Step – Apply Volume Weight
For each period
Gain_t = max(Close_t - Close_{t-1}, 0)
Loss_t = max(Close_{t-1} - Close_t, 0)
Weight_t = Volume_t / AvgVolume(N)
WeightedGain_t = Gain_t * Weight_t
WeightedLoss_t = Loss_t * Weight_t
Weighted RSI
AvgWeightedGain = SMA(WeightedGain, N)
AvgWeightedLoss = SMA(WeightedLoss, N)
RS = AvgWeightedGain / AvgWeightedLoss
AVW-RSI = 100 - (100 / (1 + RS))
Visual Features on Chart
Line Color Gradient
Color gets darker as volume weight increases, signaling stronger conviction.
Overbought/Oversold Zones
Traditional: 70/30
Suggested AVW-RSI zones: Use dynamic thresholds based on historical volatility (e.g., 80/20 for high-volume coins).
Volume Spike Flags
Mark RSI turning points that occurred during volume spikes with a special dot/symbol.
Trading Strategies with AVW-RSI
1. Weighted RSI Divergence
Regular RSI divergence becomes more powerful when volume is high.
AVW-RSI divergence with volume spike is a strong signal of reversal.
2. Trend Confirmation
RSI crossing above 50 during rising volume is a good entry signal.
RSI crossing below 50 with high volume is a strong exit or short trigger.
3. Breakout Validation
Price breaking resistance + AVW-RSI > 60 with volume = Confirmed breakout.
Price breaking but AVW-RSI < 50 or on low volume = Potential fakeout.
Example Use Case
Stock XYZ is approaching a resistance zone. A trader sees:
Standard RSI: 65 → suggests strength.
Volume is 3x the average.
AVW-RSI: 78 → signals strong momentum with institutional backing.
The trader enters confidently, knowing this isn't just low-volume hype.
Limitations / Tips
Works best on liquid assets (Forex majors, large-cap stocks, BTC/ETH).
Should be used alongside price action and volume analysis—not standalone.
Periods of extremely high volume (news events) might need smoothing to avoid spikes.

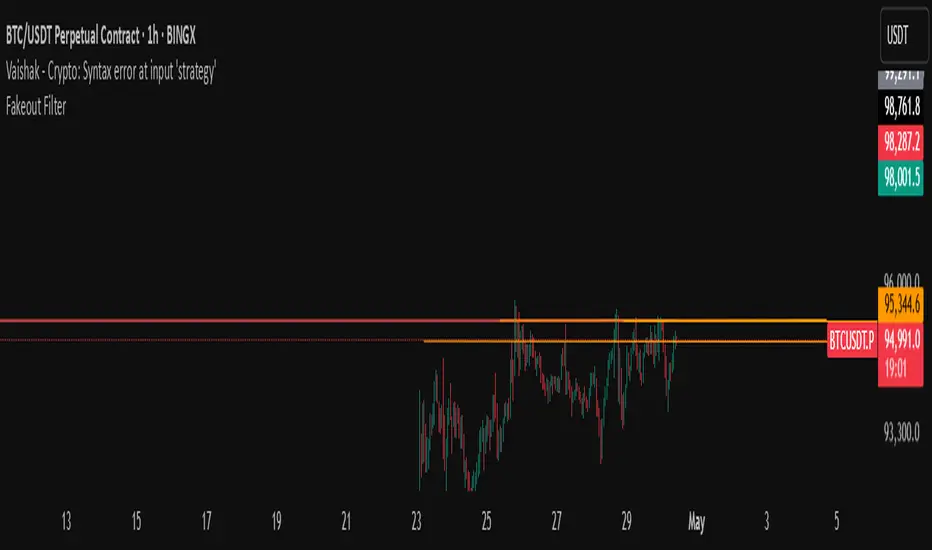
Fakeout Filter📈 Fakeout Filter by ARV
🔍 Overview:
The Fakeout Filter is a smart breakout validation tool designed to help traders avoid false breakouts and focus only on high-probability breakout trades. This indicator combines price action, volume analysis, RSI divergence detection, and OBV trend confirmation to filter out noise and improve your entries.
⚙️ Key Features:
✅ Breakout Detection
Detects when the price closes above a user-defined resistance level.
✅ Volume Spike Confirmation
Confirms breakouts only if there’s a significant increase in volume (customizable via settings).
✅ RSI Bearish Divergence Filter
Warns you of bearish RSI divergence, which often signals fakeouts during breakouts.
✅ OBV Trend Confirmation
Ensures On-Balance Volume (OBV) is rising, aligning volume flow with price movement.
✅ EMA Filter (Trend Confirmation)
Adds a safety filter using Exponential Moving Average (EMA) to ensure price action aligns with the short-term trend.
📌 How to Use:
Set Resistance Level:
In the indicator settings, input a key resistance level (manual input based on your chart analysis).
Watch for Signals:
A green background and “Breakout” label appear when:
Price closes above the resistance.
Volume is significantly higher than average.
OBV is rising.
No bearish RSI divergence is detected.
Price is above the EMA (trend confirmation).
Entry Suggestion:
Consider entering long positions only when the breakout label appears.
For additional confirmation, wait for a retest of the resistance as support before entering.
🔧 Settings:
Resistance Level – Manually set the level you're watching.
Volume Multiplier – Adjusts sensitivity to volume spikes (default: 1.5x average).
RSI Period – RSI used for divergence detection (default: 14).
EMA Period – For trend direction confirmation (default: 21).
✅ Best Use Cases:
Scalpers and intraday traders avoiding fakeouts on 5m–1H timeframes.
Swing traders validating breakout setups.
BTC, ETH, and major altcoins in consolidation or breakout zones.
⚠️ Disclaimer:
This tool is for educational purposes only. Always combine it with your own market analysis and risk management.
RSI-Volume Momentum Signal ScoreRSI-Volume Momentum Signal Score
Description
The RSI-Volume Momentum Signal Score is a predictive technical indicator designed to identify bullish and bearish momentum shifts by combining volume-based momentum with the Relative Strength Index (RSI). It generates a Signal Score derived from:
• The divergence between short-term and long-term volume (Volume Oscillator), and
• RSI positioning relative to a user-defined threshold.
This hybrid approach helps traders detect early signs of price movement based on volume surges and overbought/oversold conditions.
The Signal Score is computed as follows:
Signal Score = Volume Momentum x RSI Divergence Factor
Volume Momentum = tanh ((Volume Oscillator value (vo) – Volume Threshold)/Scaling Factor)
RSI Divergence Factor = ((RSI Threshold – RSI Period)/Scaling Factor)
Or,
Signal Score = tanh((vo - voThreshold) / scalingFactor) * ((rsiThreshold - rsi) / scalingFactor)
The logic of this formula are as follows:
• If Volume Oscillator >= Volume Threshold and RSI <= RSI Threshold: Bullish Signal (+1 x Scaling Factor)
• If Volume Oscillator >= Volume Threshold and RSI >= (100 – RSI Threshold): Bearish Signal (-1 x Scaling Factor)
• Otherwise: Neutral (0)
The tanh function provides the normalization process. It ensures that the final signal score is bounded between -1 and 1, increases sensitivity to early changes in volume patterns based on RSI conditions, and prevent sudden jumps in signals ensuring smooth and continuous signal line.
Input Fields
The input fields allow users to customize the behavior of the indicator based on their trading strategy:
Short-Term Volume MA
- Default: `2`
- Description: The period for the short-term moving average of volume.
- Purpose: Captures short-term volume trends.
Long-Term Volume MA)
- Default: `10`
- Description: The period for the long-term moving average of volume.
- Purpose: Captures long-term volume trends for comparison with the short-term trend.
RSI Period)
- Default: `3`
- Description: The period for calculating the RSI.
- Purpose: Measures the relative strength of price movements over the specified period.
Volume Oscillator Threshold
- Default: `70`
- Description: The threshold for the Volume Oscillator to determine significant volume momentum.
- Purpose: Filters out weak volume signals.
RSI Threshold
- Default: `25`
- Description: The RSI level used to identify overbought or oversold conditions.
- Purpose: Helps detect potential reversals in price momentum.
Signal Scaling Factor
- Default: `10`
- Description: A multiplier for the signal score.
- Purpose: Adjusts the magnitude of the signal score for better visualization.
How To Use It for Trading:
Upcoming Bullish Signal: Signal line turns from Gray to Green or from Green to Gray
Upcoming Bearish Signal: Signal line turns from Gray to Red or from Red to Gray
Note: The price that corresponds to the transition of Signal line from Gray to Green or Red and vise versa is the signal price for upcoming bullish or bearish signal.
The signal score dynamically adjusts based on volume and RSI thresholds, making it adaptable to various market conditions, and this is what makes the indicator unique from other traditional indicators.
Unique Features
Unlike traditional indicators, this indicator combines two different dimensions—volume trends and RSI divergence—for more comprehensive signal generation. The use of tanh() to scale and smooth the signal is a mathematically elegant way to manage signal noise and highlight genuine trends. Traders can tune the scaling factor and thresholds to adapt the indicator for scalping, swing trading, or longer-term investing.

RSI ATR Range [SS]Hey everyone,
Over the course of the last year I had a bunch of requests to do something with RSI. I did do an RSI expected move plotter, but the requests were to overhaul RSI and make it better I guess.
So here is my attempt!
This is the RSI ATR plotter. Its similar to my RSI expected move plotter, however, it gives you the ATR ranges associated with the current RSI value. This allows you to conceptualize RSI in a different way. Instead of looking for "oversold" over "overbought", you can actually just see the expected high to open range and the expected open to low range based on the current RSI.
This will allow you to determine such things as:
a) Is it likely to be bullish?
b) Is it likely to be bearish?
c) The average move, in a dollar amount, associated with this RSI.
In addition to presenting RSI in terms of ranges as opposed to the actual RSI value, the indicator will also signal likely reversal areas. Whenever there is a huge spike in RSI and range, whether it be up or down, this generally corresponds to an imminent reversal. The indicator is programmed to recognize this and plot little grey circles to notify you of an impending reversal.
Let's take a look at some reversal examples using NVDA:
In the chart above, we can see that the RSI signaled a reversal. As it was part of a downtrend, the reversal was bullish.
Let's look at a top reversal:
The chart above shows a likely downside reversal.
And some little bounce reversals here and there:
In addition to showing you the ATR range and reversals, the indicator will show you the RSI in a bar graph format:
You won't be able to look for RSI divergences, if you are a believer of those. However, you can definitely visualize them in the ATR ranges which are directly affected by the RSI readings.
Aspects of the indicator:
Bull ranges are displayed in green.
Bear ranges are displayed in red.
When green is present we know its entering or currently in a bullish RSI range:
Inversely, when it starts to shift red, we know we are entering a bearish RSI range:
There is a border that circles the range. It will be green when we are in a bullish range and red when we are in a bearish range. In addition to these 2 signals, the RSI bar chart itself will turn green in bullish ranges, and red in bearish ranges.
Here is bullish:
Here is bearish:
Customizability
You can customize the Source input for the RSI (default is close). As well as the length (default is 14).
The ATR length is defaulted to 500. My suggestion is to leave this be. You can increase it but I would not suggest decreasing it as it may omit some of the RSI ranges from its history.
And that is the indicator my friends! Hope you enjoy!
As always, safe trades!

UM-Relative Strength Index with Trending EMA and Fill
Description
This is a different take on the traditional RSI - Relative Strength Index. This indicator turns the RSI line green when above 50 and red when below 50 making directional changes highly visual. Additionally, an exponential Moving Average is drawn of the RSI. The EMA is green when trending higher and red when trending lower. The area between the RSI and EMA lines are green when the RSI is above the RSI EMA and red when the RSI is below the EMA.
About
The RSI by itself is a good tool to determine trend with the colors. It can also be used to determined overbought and oversold extremes. The EMA of the RSI is a smoothing technique. The indicator can also be used to determine trend with the directional color changes.
Recommended Usage
I look for crossovers; bullish crossovers when the RSI crosses above the EMA AND the RSI crosses above 50. A bearish crossover is when the RSI crosses down through the EMA AND crosses below 50. It can also be used for trade confirmation; for example if the RSI EMA is green consider staying long. The indicator works on any timeframe and any security. I use it on smaller timeframes, 3 minute, 1 hour, and 3 hour, to better time entries/exits.
Default settings
The defaults are the author's preferred settings:
- RSI period is 10 using the open, high, low, and close for calculation. The additional data points using the OHLC give smoother effect.
- The EMA used by default is 34.
All parameters and colors are user-configurable.
Alerts
Alerts can be set on the indicator itself and/or alert on color changes of the EMA.
Helpful Hints:
Look for positive or negative crossovers.
Look for crosses above or below 50
Look for RSI divergences, for example if a security hits a new high, the RSI does not, this a sign of subtle weakness.
Draw trend lines on the RSI line. A violation of a recent trend line may indicate a change of trend for the security.
TMA-LegacyThis is a script based on the original TMA- RSI Divergence indicator by PhoenixBinary.
The Phoenix Binary community and the TMA community built this version to be public code for the community for further use and revision after the reported passing of Phoenix Binary (The community extends our condolences to Phoenix's family.
The intended uses are the same as the original but some calculations are different and may not act or signal the same as the original.
Description of the indicator from original posting.
This indicator was inspired by Arty and Christy .
█ COMPONENTS
Here is a brief overview of the indicator from the original posting:
1 — RSI Divergence
Arty uses the RSI divergence as a tool to find entry points and possible reversals. He doesn't use the traditional overbought/oversold. He uses a 50 line. This indicator includes a 50 line and a floating 50 line.
The floating 50 line is a multi-timeframe smoothed moving average . Price is not linear, therefore, your 50 line shouldn't be either.
The RSI line is using a dynamic color algo that shows current control of the market as well as possible turning points in the market.
2 — Smoothed RSI Divergence
The Smoothed RSI Divergence is a slower RSI with different calculations to smooth out the RSI line. This gives a different perspective of price action and more of a long term perspective of the trend. When crosses of the floating 50 line up with the traditional RSI crossing floating 50.
3 — Momentum Divergence
This one will take a little bit of time to master. But, once you master this, and combined with the other two, damn these entries get downright lethal!

Wyckoff Method - Comprehensive Analysis# WYCKOFF METHOD - QUICK REFERENCE CHEAT SHEET
## 🟢 STRONGEST BUY SIGNALS
### 1. SPRING ⭐⭐⭐⭐⭐
- **What:** False breakdown below support on LOW volume
- **Look for:** Quick reversal, close above support
- **Entry:** When price closes back in range
- **Stop:** Below spring low
- **Target:** Top of range minimum
### 2. SOS (Sign of Strength) ⭐⭐⭐⭐
- **What:** Breakout above resistance on HIGH volume
- **Look for:** Wide spread up bar, strong close
- **Entry:** On breakout or wait for LPS pullback
- **Stop:** Below range top
- **Target:** Height of range projected up
### 3. SHAKEOUT ⭐⭐⭐⭐
- **What:** Sharp move below support with HIGH volume, immediate reversal
- **Look for:** Long lower wick, closes strong
- **Entry:** When price reclaims support
- **Stop:** Below shakeout low
- **Target:** Previous resistance
---
## 🔴 STRONGEST SELL SIGNALS
### 1. UTAD (Upthrust After Distribution) ⭐⭐⭐⭐⭐
- **What:** False breakout above resistance, quick rejection
- **Look for:** Spike high, weak close, often high volume
- **Entry:** When price closes back in range
- **Stop:** Above UTAD high
- **Target:** Bottom of range minimum
### 2. SOW (Sign of Weakness) ⭐⭐⭐⭐
- **What:** Breakdown below support on HIGH volume
- **Look for:** Wide spread down bar, weak close
- **Entry:** On breakdown or wait for LPSY rally
- **Stop:** Above range bottom
- **Target:** Height of range projected down
### 3. UPTHRUST ⭐⭐⭐⭐
- **What:** Move above resistance on LOW volume, weak close
- **Look for:** Long upper wick, closes in lower half
- **Entry:** When resistance holds
- **Stop:** Above upthrust high
- **Target:** Support level
---
## 📊 ACCUMULATION PHASES (Bottom Formation)
```
PHASE A: Stopping the Downtrend
├─ PS (Preliminary Support) - First buying
├─ SC (Selling Climax) - Panic bottom ⚠️ KEY EVENT
├─ AR (Automatic Rally) - Relief bounce
└─ ST (Secondary Test) - Retest SC low
PHASE B: Building the Cause
├─ Trading range forms
├─ Multiple tests of support
├─ Volume decreasing
└─ Absorption occurring
PHASE C: The Test
├─ SPRING - False breakdown ⚠️ KEY EVENT
└─ TEST - Support holds on low volume
PHASE D: Dominance Emerges
├─ SOS - Breakout ⚠️ KEY EVENT
├─ LPS - Last Point of Support (pullback)
└─ BU - Backup
PHASE E: Markup
└─ New uptrend, strong momentum
```
**Background Color:** Blue → Green (getting brighter)
**Action:** Buy in Phase C/D, Hold through Phase E
---
## 📊 DISTRIBUTION PHASES (Top Formation)
```
PHASE A: Stopping the Uptrend
├─ PSY (Preliminary Supply) - First selling
├─ BC (Buying Climax) - Euphoric top ⚠️ KEY EVENT
├─ AR (Automatic Reaction) - Sharp drop
└─ ST (Secondary Test) - Retest BC high
PHASE B: Building the Cause
├─ Trading range forms
├─ Multiple tests of resistance
├─ Demand being absorbed
└─ Volume patterns change
PHASE C: The Test
└─ UTAD - False breakout ⚠️ KEY EVENT
PHASE D: Dominance Emerges
├─ SOW - Breakdown ⚠️ KEY EVENT
└─ LPSY - Last Point of Supply (rally to exit)
PHASE E: Markdown
└─ New downtrend, strong selling
```
**Background Color:** Orange → Red (getting darker)
**Action:** Sell in Phase C/D, Stay out during Phase E
---
## 💰 VOLUME SPREAD ANALYSIS (VSA)
| Signal | Meaning | Color | Implication |
|--------|---------|-------|-------------|
| **ND** (No Demand) | Up bar, LOW volume | 🟠 Orange | Weakness - uptrend ending |
| **NS** (No Supply) | Down bar, LOW volume | 🔵 Blue | Strength - downtrend ending |
| **SV** (Stopping Volume) | VERY HIGH volume, narrow spread | 🟣 Purple | Potential reversal |
| **UT** (Upthrust) | Above resistance, LOW vol, weak close | 🔴 Red | Sell signal |
| **SO** (Shakeout) | Below support, HIGH vol, strong close | 🟢 Green | Buy signal |
---
## 🎯 VOLUME INTERPRETATION
| Volume Level | Bar Color | Meaning |
|--------------|-----------|---------|
| **VERY HIGH** (>2x average) | Dark Green/Red | Climax, potential reversal |
| **HIGH** (>1.5x average) | Light Green/Red | Strong interest |
| **NORMAL** | Gray | Average trading |
| **LOW** (<0.7x average) | Faint Gray | Testing, no interest |
---
## ⚖️ EFFORT vs RESULT
| Scenario | Volume | Spread | Meaning |
|----------|--------|--------|---------|
| **High Effort, Low Result** | HIGH | Narrow | ⚠️ Potential reversal |
| **Low Effort, High Result** | LOW | Wide | ⚠️ Trend weakening |
| **High Effort, High Result** | HIGH | Wide | ✅ Strong trend |
| **Low Effort, Low Result** | LOW | Narrow | 😴 No interest |
---
## 📏 TRADING RULES
### ✅ DO:
- ✅ Wait for confirmation before entering
- ✅ Trade in direction of higher timeframe
- ✅ Use springs and UTAD as primary signals
- ✅ Measure trading range for targets
- ✅ Place stops outside the range
- ✅ Look for volume confirmation
- ✅ Check multiple timeframes
- ✅ Focus on Phase C and D events
### ❌ DON'T:
- ❌ Buy during Phase E Markdown
- ❌ Sell during Phase E Markup
- ❌ Trade against major trend
- ❌ Ignore volume signals
- ❌ Enter without clear stop loss
- ❌ Trade every signal
- ❌ Use on very low timeframes without practice
- ❌ Ignore the context
---
## 🎪 COMPOSITE OPERATOR (Smart Money)
### 💰 Green Money Symbol (Bottom)
- **Meaning:** Institutions accumulating
- **Location:** Demand zones, springs, tests
- **Action:** Follow the smart money - buy
### 💰 Red Money Symbol (Top)
- **Meaning:** Institutions distributing
- **Location:** Supply zones, UTAD, weak rallies
- **Action:** Follow the smart money - sell
---
## 📍 SUPPLY & DEMAND ZONES
### 🟢 Demand Zones (Green Boxes)
- **Created at:** SC, Spring, Shakeout
- **Represents:** Where smart money bought
- **Action:** Look for bounces
### 🔴 Supply Zones (Red Boxes)
- **Created at:** BC, UTAD, Upthrust
- **Represents:** Where smart money sold
- **Action:** Look for rejections
---
## 🎯 TARGET CALCULATION
### Measured Move Method
```
1. Measure trading range height
Example: Top at 120, Bottom at 100 = 20 points
2. Add to breakout point (accumulation)
Breakout at 120 + 20 = Target: 140
3. Or subtract from breakdown (distribution)
Breakdown at 100 - 20 = Target: 80
```
### Multiple Targets
- **Conservative:** 1x range height (100% probability reached)
- **Moderate:** 1.5x range height (70% probability)
- **Aggressive:** 2x range height (40% probability)
---
## ⏰ TIMEFRAME GUIDE
| Timeframe | Use For | Reliability | Recommended For |
|-----------|---------|-------------|-----------------|
| **Weekly** | Major trends | ⭐⭐⭐⭐⭐ | Position traders |
| **Daily** | Swing trades | ⭐⭐⭐⭐⭐ | Most traders |
| **4-Hour** | Active swing | ⭐⭐⭐⭐ | Active traders |
| **1-Hour** | Day trading | ⭐⭐⭐ | Experienced only |
| **15-Min** | Scalping | ⭐⭐ | Experts only |
**Golden Rule:** Always check one timeframe higher for context!
---
## 🚨 ALERT PRIORITY
### 🔔 MUST-HAVE ALERTS
1. Spring
2. UTAD
3. SOS
4. SOW
### 🔔 NICE-TO-HAVE ALERTS
5. Selling Climax (SC)
6. Buying Climax (BC)
7. Smart Money Accumulation
8. Smart Money Distribution
### 🔔 CONFIRMATION ALERTS
9. Phase E Markup
10. Phase E Markdown
---
## 💡 QUICK DECISION TREE
```
Is there a clear trading range?
├─ YES
│ ├─ Did price break BELOW support?
│ │ ├─ Volume LOW + Quick reversal = SPRING → BUY ✅
│ │ └─ Volume HIGH + Stays down = Breakdown → SELL ⚠️
│ │
│ └─ Did price break ABOVE resistance?
│ ├─ Volume LOW + Quick reversal = UTAD → SELL ✅
│ └─ Volume HIGH + Stays up = Breakout → BUY ⚠️
│
└─ NO
├─ Strong uptrend = Wait for re-accumulation
└─ Strong downtrend = Wait for re-distribution
```
---
## 📝 PRE-TRADE CHECKLIST
Before entering any trade:
- Identified the current Wyckoff phase
- Confirmed with volume analysis
- Checked higher timeframe trend
- Located supply/demand zones
- Identified clear entry point
- Set stop loss level
- Calculated target (risk:reward >1:2)
- Verified position size (risk 1-2%)
- Have at least 2 confirming signals
- Not trading against major trend
---
## 🧠 REMEMBER
**The Three Laws:**
1. **Supply & Demand** - Price is determined by imbalance
2. **Cause & Effect** - Range size predicts move size
3. **Effort & Result** - Volume should confirm price movement
**The Key Principle:**
> "Trade with the Composite Operator (smart money), not against them"
**Best Setups:**
1. Spring in accumulation (Phase C)
2. UTAD in distribution (Phase C)
3. SOS breakout (Phase D)
4. SOW breakdown (Phase D)
**When in Doubt:**
- ❓ Stay out
- 📈 Use higher timeframe
- 📚 Review the documentation
- 🎯 Wait for clearer signal
---
## 📱 INDICATOR SETTINGS QUICK SETUP
**For Stocks/Crypto (Good Volume Data):**
- Volume MA Length: 20
- High Volume Multiplier: 1.5
- Climax Volume: 2.0
- Swing Length: 5
**For Forex (Limited Volume Data):**
- Volume MA Length: 20
- High Volume Multiplier: 1.3
- Climax Volume: 1.8
- Swing Length: 7
- Turn OFF "Volume Confirmation"
**For Day Trading:**
- Swing Length: 3
- All other settings: Default
**For Position Trading:**
- Swing Length: 7-10
- Volume MA Length: 30
- Use Daily/Weekly charts
---
## 🎓 SKILL PROGRESSION
### Beginner (Month 1-2)
- Focus on: SC, Spring, SOS
- Timeframe: Daily only
- Goal: Identify phases correctly
### Intermediate (Month 3-6)
- Add: All accumulation events
- Timeframe: Daily + 4H
- Goal: Trade springs profitably
### Advanced (Month 6-12)
- Add: Distribution events, VSA
- Timeframe: Multiple timeframes
- Goal: Trade complete cycles
### Expert (Year 2+)
- Master: All events, all timeframes
- Combine: With other methodologies
- Goal: Consistent profitability
---
**Print this sheet and keep it next to your trading desk!**
*Remember: Quality over quantity. Wait for the best setups.*
# Wyckoff Method - Comprehensive Analysis Indicator
## Complete Implementation Guide for TradingView Pine Script
---
## TABLE OF CONTENTS
1. (#overview)
2. (#installation)
3. (#theory)
4. (#components)
5. (#signals)
6. (#strategies)
7. (#settings)
8. (#alerts)
9. (#patterns)
10. (#troubleshooting)
---
## OVERVIEW
This indicator implements Richard Wyckoff's complete trading methodology, including:
- **All 5 Phases** of Accumulation and Distribution
- **18+ Wyckoff Events** (PS, SC, AR, ST, Spring, SOS, LPS, BC, UTAD, SOW, etc.)
- **Volume Spread Analysis (VSA)** principles
- **Supply & Demand Zone** detection
- **Composite Operator** logic (Smart Money tracking)
- **Effort vs Result** analysis
- **Three Wyckoff Laws**: Supply/Demand, Cause/Effect, Effort/Result
---
## INSTALLATION
### Step 1: Copy the Code
1. Open the `wyckoff_comprehensive.pine` file
2. Select all code (Ctrl+A / Cmd+A)
3. Copy to clipboard (Ctrl+C / Cmd+C)
### Step 2: Add to TradingView
1. Go to TradingView.com
2. Open any chart
3. Click "Pine Editor" at the bottom of the screen
4. Click "New" or "Open"
5. Paste the entire code
6. Click "Save" and give it a name
7. Click "Add to Chart"
### Step 3: Verify Installation
You should see:
- Labels on the chart (PS, SC, Spring, SOS, etc.)
- Background colors indicating phases
- Volume analysis in the lower pane
- A table in the top-right corner showing current phase
---
## WYCKOFF METHOD THEORY
### The Three Fundamental Laws
#### 1. **Law of Supply and Demand**
- Price rises when demand exceeds supply
- Price falls when supply exceeds demand
- The indicator tracks volume vs price movement to identify imbalances
#### 2. **Law of Cause and Effect**
- A period of accumulation (cause) leads to markup (effect)
- A period of distribution (cause) leads to markdown (effect)
- Trading ranges build "cause" for future price movement
#### 3. **Law of Effort vs Result**
- **Effort** = Volume (energy put into the market)
- **Result** = Price movement (spread of the bar)
- High effort with low result = potential reversal
- Low effort with high result = trend weakness
### The Five Phases
#### **ACCUMULATION CYCLE**
**Phase A: Stopping the Downtrend**
- Preliminary Support (PS): First sign of buying
- Selling Climax (SC): Panic selling exhaustion
- Automatic Rally (AR): Bounce from SC
- Secondary Test (ST): Test of SC low on lower volume
**Phase B: Building the Cause**
- Trading range develops
- Supply being absorbed by composite operator
- Multiple tests of support and resistance
- Volume generally decreases
**Phase C: The Test (Spring)**
- False breakdown below support
- Traps late sellers
- Quick reversal on low volume
- Last chance to accumulate before markup
**Phase D: Dominance Emerges**
- Sign of Strength (SOS): Break above resistance
- Last Point of Support (LPS): Pullback opportunity
- Backup (BU): Final consolidation
- Demand clearly exceeds supply
**Phase E: Markup**
- New uptrend established
- Price moves rapidly higher
- Phase E can last months/years
- Original trading range becomes support
#### **DISTRIBUTION CYCLE**
**Phase A: Stopping the Uptrend**
- Preliminary Supply (PSY): First sign of selling
- Buying Climax (BC): Euphoric buying exhaustion
- Automatic Reaction (AR): Sharp selloff from BC
- Secondary Test (ST): Test of BC high on lower volume
**Phase B: Building the Cause**
- Trading range at top
- Demand being absorbed by composite operator
- Multiple tests of support and resistance
**Phase C: The Test (UTAD)**
- Upthrust After Distribution
- False breakout above resistance
- Traps late buyers
- Quick reversal
**Phase D: Dominance Emerges**
- Sign of Weakness (SOW): Break below support
- Last Point of Supply (LPSY): Rally opportunity to exit
- Supply clearly exceeds demand
**Phase E: Markdown**
- New downtrend established
- Price moves rapidly lower
- Original trading range becomes resistance
---
## INDICATOR COMPONENTS
### 1. EVENT LABELS
#### Accumulation Events (Green labels)
- **PS** = Preliminary Support
- **SC** = Selling Climax (largest label, most important)
- **AR** = Automatic Rally
- **ST** = Secondary Test
- **SPRING** = Spring (critical buy signal)
- **TEST** = Test of support
- **SOS** = Sign of Strength (breakout)
- **LPS** = Last Point of Support
- **BU** = Backup
#### Distribution Events (Red labels)
- **PSY** = Preliminary Supply
- **BC** = Buying Climax (largest label, most important)
- **AR** = Automatic Reaction
- **ST** = Secondary Test
- **UTAD** = Upthrust After Distribution (critical sell signal)
- **SOW** = Sign of Weakness
- **LPSY** = Last Point of Supply
#### VSA Events (Small colored labels)
- **ND** (Orange) = No Demand - weakness
- **NS** (Blue) = No Supply - strength
- **SV** (Purple) = Stopping Volume
- **UT** (Red) = Upthrust - weakness
- **SO** (Green) = Shakeout - strength
#### Composite Operator (💰 symbols)
- Green 💰 at bottom = Smart Money Accumulation
- Red 💰 at top = Smart Money Distribution
### 2. BACKGROUND COLORS
- **Light Blue** = Phase A (Accumulation)
- **Light Orange** = Phase A (Distribution)
- **Very Light Green** = Phase C (Accumulation Testing)
- **Very Light Red** = Phase C (Distribution Testing)
- **Light Green** = Phase D (Accumulation Strength)
- **Light Red** = Phase D (Distribution Weakness)
- **Green** = Phase E (Markup - Bull trend)
- **Red** = Phase E (Markdown - Bear trend)
### 3. SUPPLY & DEMAND ZONES
- **Green boxes** = Demand zones (where smart money accumulated)
- **Red boxes** = Supply zones (where smart money distributed)
- Zones extend 20 bars into the future
- Price reactions at these zones are significant
### 4. VOLUME PANEL
- **Dark Green/Red bars** = Very High Volume (climax)
- **Light Green/Red bars** = High Volume
- **Gray bars** = Normal Volume
- **Faint Gray bars** = Low Volume
- **Blue line** = Volume Moving Average
### 5. INFORMATION TABLE (Top Right)
Displays real-time analysis:
- **Current Phase** (A, B, C, D, or E)
- **Status** (description of what's happening)
- **Volume** (Very High, High, Normal, Low)
- **Spread** (Wide, Normal, Narrow)
- **Effort/Result** (Poor, Normal, Good)
- **Range** (YES if in trading range)
- **Bias** (BULLISH, BEARISH, or NEUTRAL)
---
## HOW TO READ THE SIGNALS
### STRONG BUY SIGNALS (in order of strength)
1. **SPRING** (strongest)
- False breakdown below support
- Look for: Low volume, quick reversal, close above support
- Entry: When price closes back above support level
- Stop: Below the spring low
2. **SOS (Sign of Strength)**
- Break above trading range resistance
- Look for: High volume, wide spread up bar
- Entry: On breakout or pullback to LPS
- Stop: Below trading range
3. **Shakeout (SO)**
- Similar to spring but more violent
- Look for: High volume, penetration of support, strong close
- Entry: When price reclaims support
- Stop: Below shakeout low
4. **LPS (Last Point of Support)**
- Pullback after SOS
- Look for: Low volume, shallow pullback
- Entry: When support holds
- Stop: Below LPS
5. **No Supply (NS)**
- Down bar on very low volume
- Indicates lack of selling pressure
- Confirms accumulation phase
### STRONG SELL SIGNALS (in order of strength)
1. **UTAD (Upthrust After Distribution)** (strongest)
- False breakout above resistance
- Look for: High volume spike, rejection, close below resistance
- Entry: When price closes back below resistance
- Stop: Above UTAD high
2. **SOW (Sign of Weakness)**
- Break below trading range support
- Look for: High volume, wide spread down bar
- Entry: On breakdown or rally to LPSY
- Stop: Above trading range
3. **Upthrust (UT)**
- Move above resistance on low volume, weak close
- Look for: Low volume, close in lower half of bar
- Entry: When resistance becomes resistance again
- Stop: Above upthrust high
4. **LPSY (Last Point of Supply)**
- Rally after SOW
- Look for: Low volume, weak rally
- Entry: When rally fails
- Stop: Above LPSY
5. **No Demand (ND)**
- Up bar on very low volume
- Indicates lack of buying pressure
- Confirms distribution phase
### NEUTRAL/WARNING SIGNALS
- **High Effort, Low Result** = Potential reversal coming
- **Stopping Volume** = Trend may be ending
- **Absorption** = Large volume with small movement (accumulation/distribution)
---
## TRADING STRATEGY EXAMPLES
### Strategy 1: Accumulation Range Breakout
**Setup:**
1. Identify trading range (blue background in Phase B)
2. Wait for Spring or Test (Phase C)
3. Wait for SOS breakout (Phase D)
**Entry:**
- Option A: Buy on SOS breakout
- Option B: Wait for LPS pullback (better risk/reward)
**Stop Loss:**
- Below the spring low or trading range bottom
**Target:**
- Measure height of trading range (cause)
- Project upward from breakout point (effect)
- Minimum target = range height
**Example:**
```
Trading Range: 100 to 120 (20 point range)
SOS Breakout at: 120
Target: 120 + 20 = 140 minimum
```
### Strategy 2: Distribution Range Breakdown
**Setup:**
1. Identify trading range after uptrend
2. Wait for UTAD (Phase C)
3. Wait for SOW breakdown (Phase D)
**Entry:**
- Option A: Sell on SOW breakdown
- Option B: Wait for LPSY rally (better risk/reward)
**Stop Loss:**
- Above the UTAD high or trading range top
**Target:**
- Measure height of trading range
- Project downward from breakdown point
- Minimum target = range height
### Strategy 3: Spring Trading
**Setup:**
1. Strong downtrend followed by range
2. Price breaks below range bottom
3. Volume is LOW on breakdown
4. Price quickly reverses and closes above support
**Entry:**
- When candle closes above support level
- Or on retest of support
**Stop Loss:**
- Below spring low (usually tight)
**Target:**
- Top of trading range
- Previous swing high
**Risk/Reward:**
- Typically 1:3 or better
### Strategy 4: Smart Money Tracking
**Setup:**
1. Look for 💰 symbols in demand zones
2. Multiple accumulation signals (PS, SC, ST, Test)
3. Volume decreasing during range
**Entry:**
- At next demand zone test
- On SOS breakout
**Confirmation:**
- Background turning green (Phase D/E)
- Table shows "BULLISH" bias
### Strategy 5: VSA Reversal
**Setup:**
1. Strong trend in place
2. Stopping Volume (SV) appears at extreme
3. Followed by No Demand (ND) or No Supply (NS)
**Entry:**
- When trend breaks down/up
- On retest of extreme
**Example (Bullish):**
```
Downtrend → Stopping Volume → No Supply → Up bar
Entry: Buy when price moves above SV bar
```
---
## SETTINGS & CUSTOMIZATION
### Volume Analysis Settings
**Volume MA Length** (default: 20)
- Shorter = More sensitive to volume changes
- Longer = Smoother, less noise
- Recommended: 15-25 for most timeframes
**High Volume Multiplier** (default: 1.5)
- Threshold for "high volume"
- Lower = More signals
- Higher = Only extreme volume
- Recommended: 1.3-2.0
**Climax Volume Multiplier** (default: 2.0)
- Threshold for climax events (SC, BC)
- Should be significantly higher than normal
- Recommended: 2.0-3.0
### Phase Detection Settings
**Swing Detection Length** (default: 5)
- How many bars to look left/right for swing points
- Shorter = More swings detected (more noise)
- Longer = Fewer swings (cleaner, might miss some)
- Recommended: 3-7
**Range Expansion Threshold** (default: 1.5)
- Multiplier for "wide spread" bars
- Higher = Only very wide bars qualify
- Recommended: 1.3-2.0
**Volume Confirmation** (default: ON)
- Requires volume confirmation for events
- Turn OFF for very low volume instruments
- Keep ON for stocks, forex, crypto
### Display Options
Toggle on/off:
- ✅ **Show Accumulation/Distribution Phases** - Background colors
- ✅ **Show Wyckoff Events** - All labeled events
- ✅ **Show Volume Spread Analysis** - VSA labels
- ✅ **Show Supply/Demand Zones** - Boxes on chart
- ✅ **Show Composite Operator Signals** - 💰 symbols
### Color Customization
- **Bullish Color** - All accumulation events
- **Bearish Color** - All distribution events
- **Neutral Color** - Range/neutral signals
---
## ALERT SETUP
### Available Alerts
1. **Selling Climax (SC)** - Potential bottom forming
2. **Spring** - Strong buy signal
3. **Sign of Strength (SOS)** - Bullish breakout
4. **Buying Climax (BC)** - Potential top forming
5. **UTAD** - Strong sell signal
6. **Sign of Weakness (SOW)** - Bearish breakdown
7. **Phase E Markup** - Uptrend confirmed
8. **Phase E Markdown** - Downtrend confirmed
9. **Smart Money Accumulation** - Institutions buying
10. **Smart Money Distribution** - Institutions selling
### How to Set Up Alerts
1. Click the "⏰" icon on TradingView
2. Select "Create Alert"
3. Condition: Choose the indicator and alert type
4. Example: "Wyckoff Method - Spring"
5. Set notification preferences (popup, email, webhook)
6. Click "Create"
### Recommended Alert Strategy
**Conservative Trader:**
- Spring
- SOS
- UTAD
- SOW
**Aggressive Trader:**
- Add: SC, BC, Smart Money signals
**Long-term Investor:**
- Phase E Markup
- Phase E Markdown
- Smart Money Accumulation
---
## COMMON PATTERNS
### Pattern 1: Classic Accumulation
```
Phase A: Downtrend → PS → SC → AR → ST
Phase B: Range building (4-12 weeks typical)
Phase C: Spring (false breakdown)
Phase D: SOS → LPS → BU
Phase E: Markup (new uptrend)
```
**What to do:**
- Mark the range boundaries
- Wait for spring
- Buy on LPS or SOS
- Hold through markup
### Pattern 2: Classic Distribution
```
Phase A: Uptrend → PSY → BC → AR → ST
Phase B: Range building (topping process)
Phase C: UTAD (false breakout)
Phase D: SOW → LPSY
Phase E: Markdown (new downtrend)
```
**What to do:**
- Mark the range boundaries
- Wait for UTAD
- Sell on LPSY or SOW
- Stay out during markdown
### Pattern 3: Re-Accumulation
```
Uptrend → Trading Range → Spring → Uptrend continues
```
- Occurs during existing uptrend
- Shorter accumulation period
- Often no clear SC (trend is already up)
- Spring is the key signal
### Pattern 4: Re-Distribution
```
Downtrend → Trading Range → UTAD → Downtrend continues
```
- Occurs during existing downtrend
- Shorter distribution period
- Often no clear BC (trend is already down)
- UTAD is the key signal
### Pattern 5: Failed Breakout
**Bullish Failed Breakout:**
```
Range → Breakdown → Immediate reversal (Spring)
```
- Price breaks support
- Volume is LOW
- Immediate strong reversal
- Very bullish
**Bearish Failed Breakout:**
```
Range → Breakout → Immediate reversal (UTAD)
```
- Price breaks resistance
- Volume may be high initially
- Quick rejection and reversal
- Very bearish
---
## TIMEFRAME RECOMMENDATIONS
### Daily Charts (Most Reliable)
- Best for swing trading
- Clear phases and events
- Less noise
- Recommended for beginners
### 4-Hour Charts
- Good for active swing traders
- Faster signals than daily
- Still reliable
### 1-Hour Charts
- For day traders
- More false signals
- Need to filter carefully
- Use in conjunction with higher timeframe
### 15-Minute / 5-Minute
- Only for experienced traders
- High noise level
- Many false signals
- Use daily chart for context
**Golden Rule:** Always check higher timeframe first!
---
## MULTI-TIMEFRAME ANALYSIS
### Top-Down Approach (Recommended)
1. **Weekly Chart** - Identify major trend and phase
2. **Daily Chart** - Find current accumulation/distribution
3. **4H Chart** - Identify entry timing
4. **Entry Timeframe** - Execute trade
### Example Analysis:
**Weekly:** Phase E Markup (bullish)
**Daily:** Phase B Re-accumulation
**4-Hour:** Spring detected
**Action:** Buy on daily LPS
---
## WYCKOFF + OTHER INDICATORS
### Complementary Tools
1. **Moving Averages**
- 20/50 SMA for trend context
- Already plotted on indicator
2. **RSI**
- Divergences at SC/BC
- Confirms overbought/oversold
3. **MACD**
- Confirms trend change in Phase D
- Divergences support Wyckoff events
4. **Volume Profile**
- Identifies value areas
- Confirms supply/demand zones
5. **Order Flow / Footprint Charts**
- See institutional activity
- Confirms smart money signals
**Don't Over-Complicate:**
- Wyckoff is a complete system
- Other indicators are supplementary
- When in doubt, trust Wyckoff
---
## TROUBLESHOOTING
### Issue: Too Many Labels
**Solution:**
- Increase swing length (Settings → 7 or 10)
- Increase volume multipliers
- Turn off VSA labels if not needed
- Focus on major events only (SC, Spring, SOS, BC, UTAD, SOW)
### Issue: Missing Expected Events
**Solution:**
- Decrease swing length (Settings → 3)
- Decrease volume multipliers
- Turn OFF volume confirmation
- Check timeframe (use daily chart)
### Issue: False Signals
**Solution:**
- Use higher timeframe
- Wait for confirmation
- Don't trade against major trend
- Look for multiple signal convergence
### Issue: Can't See Background Colors
**Solution:**
- Check "Show Phases" is enabled
- Increase monitor brightness
- Colors are subtle by design (not to obscure price)
### Issue: Volume Shows Incorrectly
**Solution:**
- Ensure volume data is available for your symbol
- Some symbols have poor volume data
- Forex spot pairs have no real volume
- Use futures or stock markets for best results
### Issue: No Trading Range Detected
**Solution:**
- Market may be trending strongly
- Trading range might be too small
- Wait for price to consolidate
- Not all markets have clear ranges
---
## ADVANCED TIPS
### 1. Count Point & Figure Charts
- Wyckoff used P&F to measure "cause"
- Width of range × height = minimum move target
- Longer accumulation = larger markup
### 2. Watch for Absorption
- High volume + narrow spread = someone absorbing
- In downtrend = accumulation
- In uptrend = distribution
### 3. Multiple Timeframe Springs
- Spring on daily + spring on weekly = very strong
- Increases probability significantly
### 4. Failed Signals Are Signals Too
- Failed spring = weakness, expect lower
- Failed UTAD = strength, expect higher
### 5. Context is King
- Don't buy during Phase E Markdown
- Don't sell during Phase E Markup
- Respect the major trend
### 6. Volume Precedes Price
- Study volume changes first
- Price follows volume
- Decreasing volume in range = building energy
### 7. Composite Operator Mindset
- Think like institutions
- Where would smart money buy/sell?
- They need liquidity (retail traders)
---
## RISK MANAGEMENT
### Position Sizing
**Conservative:**
- Risk 1% per trade
- Wider stops at range boundaries
**Moderate:**
- Risk 1-2% per trade
- Stops below spring/above UTAD
**Aggressive:**
- Risk 2-3% per trade
- Tight stops
- Higher win rate needed
### Stop Loss Placement
**Accumulation:**
- Below spring low
- Below trading range bottom
- Below demand zone
**Distribution:**
- Above UTAD high
- Above trading range top
- Above supply zone
### Take Profit Strategy
**Method 1: Measured Move**
- Range height = minimum target
- 2x range height = extended target
**Method 2: Fibonacci Extensions**
- 1.0 = range height
- 1.618 = extended target
- 2.618 = maximum target
**Method 3: Trail the Stop**
- Move stop to breakeven at 1R
- Trail under swing lows in markup
- Lock in profits progressively
---
## BACKTESTING CHECKLIST
Before trading with real money:
- Backtest on 50+ historical examples
- Record all signals in trading journal
- Calculate win rate (aim for >50%)
- Calculate average R:R (aim for >1:2)
- Test on multiple instruments
- Test on multiple timeframes
- Test in different market conditions
- Verify signal consistency
- Practice on demo account
- Start small with real money
---
## RECOMMENDED READING
### Books
1. **"Studies in Tape Reading"** - Richard D. Wyckoff
2. **"The Richard D. Wyckoff Method"** - Rubén Villahermosa
3. **"Charting the Stock Market: The Wyckoff Method"** - Jack Hutson
4. **"Master the Markets"** - Tom Williams (VSA)
### Courses
1. Wyckoff Analytics - Official Wyckoff course
2. TradeVSA - Volume Spread Analysis
3. StockCharts - Wyckoff education
### Communities
1. Wyckoff Analytics Forum
2. Reddit r/Wyckoff
3. TradingView Wyckoff ideas section
---
## FREQUENTLY ASKED QUESTIONS
**Q: Can I use this on crypto?**
A: Yes, works well on major cryptocurrencies with good volume.
**Q: Does it work on forex?**
A: Yes, but use futures volume (like 6E for EUR/USD) for better accuracy.
**Q: What's the best timeframe?**
A: Daily chart for most traders. 4H for more active trading.
**Q: How long does accumulation last?**
A: Typically 2-12 weeks. Longer accumulation = bigger markup.
**Q: Can I automate this?**
A: You can use the alerts, but manual analysis is recommended.
**Q: What's the win rate?**
A: With proper filtering: 60-70% on major signals (Spring, UTAD, SOS, SOW).
**Q: Should I trade every signal?**
A: No. Focus on Spring, UTAD, SOS, and SOW in trending markets.
**Q: What if I see conflicting signals?**
A: Use higher timeframe for context. When in doubt, stay out.
**Q: How do I know which phase I'm in?**
A: Check the table in top-right corner. Also look at background color.
**Q: Can I use this for options trading?**
A: Yes, excellent for timing option entries (especially around Spring/UTAD).
---
## FINAL THOUGHTS
The Wyckoff Method is:
- **A complete trading system** (not just an indicator)
- **Based on 100+ years** of market wisdom
- **Used by institutions** and professional traders
- **Requires practice** and screen time
- **Highly effective** when applied correctly
**Success Tips:**
1. Start with daily charts
2. Focus on major events (SC, Spring, SOS, BC, UTAD, SOW)
3. Always check higher timeframe context
4. Wait for confirmation before entering
5. Manage risk properly
6. Keep a trading journal
7. Be patient - wait for the best setups
**Remember:**
- Not every range will have all events
- Some phases may be abbreviated
- Context and confluence matter most
- Practice makes perfect
---
## SUPPORT & UPDATES
For questions, improvements, or bug reports:
- Check TradingView script comments
- Join Wyckoff trading communities
- Study historical examples
- Practice on demo accounts
**Good luck and happy trading!**
---
*Disclaimer: This indicator is for educational purposes. Always do your own analysis and risk management. Past performance does not guarantee future results.*
# WYCKOFF VISUAL SETUP EXAMPLES
## ACCUMULATION SCHEMATIC #1 (Classic Bottom)
```
Price Chart View:
│ PHASE E
│ MARKUP
│ ╱
│ ╱
┌─SOS─────┤ ╱
│ │ ╱
┌───────────┤ ┌LPS │╱
│ PHASE B │ │ │
│ (Cause) └──┴──────┤
┌AR──┤ │
┌────┤ │ ┌─Spring │ PHASE D
│ └ST──┤ │ │
│ │ │ │
────SC────────┴─────────┴───────────┴──────────
│
PS
│ PHASE A
│
Downtrend
```
### PHASE A - Stopping the Downtrend
```
PS: │ High volume down bar
▼ First sign of support
■ Not bottom yet
SC: │ VERY HIGH volume
▼ Panic selling exhaustion
█ Long lower wick
█ This is the low
AR: │ Automatic rally
▲ Relief bounce
■ High volume acceptable
ST: │ Secondary test
▼ Low volume (KEY!)
■ Tests SC low
```
### PHASE B - Building the Cause
```
┌─────────┐
│ ~~~ │ Multiple tests
│ ~ ~ │ Volume decreases
│~ ~ │ Range gets tighter
└─────────┘
Duration: 2-12 weeks typical
The longer, the bigger the eventual move
```
### PHASE C - The Test (SPRING)
```
║ False breakdown
─────╨─────
▼ Low volume
█ Breaks below support
■
█ Quick reversal
▲ Closes ABOVE support
CRITICAL: Volume must be LOW
Close must be strong
Happens quickly (1-3 bars)
```
### PHASE D - Strength Emerges
```
SOS: ▲ Sign of Strength
────╥──── Break above resistance
║ High volume
║ Wide spread
LPS: ▼ Last Point Support
■ Pullback on LOW volume
▲ Great entry point
BU: ▲ Backup
■ Final consolidation
▲ Before markup
```
### PHASE E - Markup
```
╱
╱
╱ Strong uptrend
╱ High momentum
╱ Can last months/years
──╱──
```
---
## DISTRIBUTION SCHEMATIC #2 (Classic Top)
```
Price Chart View:
Uptrend
│
PSY
│ PHASE A
────BC────────┬─────────┬───────────┬──────────
│ │ UTAD │
│ PHASE B │ │ PHASE D
┌AR──┤ ┌LPSY │ │
│ │ │ └───────────┤
│ └──┴──────┐ │╲
└ST──┤ │ │ ╲
│ └───────────┤ ╲
└─SOW─────┤ │ ╲
│ │ ╲
│ PHASE C │ ╲
│ │ PHASE E
│ │ MARKDOWN
```
### PHASE A - Stopping the Uptrend
```
PSY: │ High volume up bar
▲ Preliminary supply
■ Selling starting
BC: │ VERY HIGH volume
▲ Buying climax
█ Euphoric top
█ Long upper wick
AR: │ Automatic reaction
▼ Sharp selloff
■ High volume
ST: │ Secondary test
▲ Low volume (KEY!)
■ Tests BC high
```
### PHASE C - The Test (UTAD)
```
▲ False breakout
────╥────
║ Breaks ABOVE resistance
║ Often high volume spike
▼
█ Rejection / weak close
█ Closes BELOW resistance
▼
CRITICAL: Closes weak
Quick rejection
Traps buyers
```
### PHASE D - Weakness Emerges
```
SOW: ▼ Sign of Weakness
────╨──── Break below support
║ High volume
║ Wide spread
LPSY: ▲ Last Point Supply
■ Rally on LOW volume
▼ Last chance to exit
```
---
## VOLUME PATTERNS (Critical to Understanding)
### ACCUMULATION Volume Pattern
```
Volume
│ SC
█
█ ST
■ ■ Spring
■ ■ ■ SOS LPS
──┴────┴────┴──────█───■────►
│ │ │ │ │
│ │ │ │ │
A A C D D
Pattern: HIGH → low → low → HIGH → low
Key: Volume DECREASES during range
INCREASES on breakout
```
### DISTRIBUTION Volume Pattern
```
Volume
│ BC
█
█ ST
■ ■ UTAD
■ ■ ■ SOW LPSY
──┴────┴────┴──────█───■────►
│ │ │ │ │
│ │ │ │ │
A A C D D
Pattern: HIGH → low → varies → HIGH → low
Key: Volume MAY increase on UTAD
Definitely HIGH on breakdown (SOW)
```
---
## REAL TRADE SETUPS
### Setup #1: SPRING BUY
```
Entry Conditions:
1. Clear trading range identified
2. Price breaks BELOW support
3. Volume is LOW (critical!)
4. Price reverses QUICKLY
5. Closes ABOVE support level
Entry: Next bar or on retest
Stop: Below spring low
Target: Top of range (minimum)
Example:
Support: $100
Spring low: $98 (low volume)
Close: $101
Entry: $102
Stop: $97.50
Target: $120 (range top)
Risk/Reward: 1:4
```
### Setup #2: UTAD SELL
```
Entry Conditions:
1. Clear trading range identified (after uptrend)
2. Price breaks ABOVE resistance
3. Often high volume spike
4. Price reverses QUICKLY
5. Closes BELOW resistance level
Entry: Next bar or on retest
Stop: Above UTAD high
Target: Bottom of range (minimum)
Example:
Resistance: $200
UTAD high: $205 (spike)
Close: $198
Entry: $197
Stop: $206
Target: $180 (range bottom)
Risk/Reward: 1:2
```
### Setup #3: SOS BREAKOUT
```
Entry Conditions:
1. Clear accumulation range
2. Spring already occurred (ideal)
3. Price breaks ABOVE resistance
4. HIGH volume on breakout
5. Wide spread up bar
Entry Option A: On breakout ($120)
Entry Option B: Wait for LPS pullback ($115)
Stop: Below range or LPS
Target: Range height projected up
Example:
Range: $100-$120 (20 points)
SOS breakout: $120
Entry A: $120
Stop: $115
Target 1: $140 (100%)
Target 2: $150 (150%)
```
---
## VSA SPECIFIC PATTERNS
### Pattern 1: No Demand (Weakness)
```
▲
■ Up bar
■ Low volume ◄── KEY
▲ Small body
Context: After uptrend
Meaning: Buyers exhausted
Action: Prepare to sell
```
### Pattern 2: No Supply (Strength)
```
▼
■ Down bar
■ Low volume ◄── KEY
▼ Small body
Context: After downtrend
Meaning: Sellers exhausted
Action: Prepare to buy
```
### Pattern 3: Stopping Volume
```
═ Very high volume
█ Narrow spread ◄── KEY
═ Price not moving
Context: At extremes
Meaning: Absorption
Action: Expect reversal
```
---
## COMMON MISTAKES (What NOT to Do)
### ❌ Mistake 1: Buying Prematurely
```
WRONG:
SC
▼
█ ← DON'T BUY HERE
CORRECT:
Spring
─────╨─────
▼
█ ← BUY HERE
▲
```
### ❌ Mistake 2: Ignoring Volume
```
WRONG: "It broke below support, must be spring"
─────╨───── High volume
█
This is a BREAKDOWN, not a spring!
CORRECT Spring:
─────╨───── LOW volume ✓
■ Quick reversal ✓
▲
```
### ❌ Mistake 3: Trading Against Trend
```
WRONG:
Markdown Phase E
╲
╲ ← Trying to buy here
╲
╲
CORRECT:
Wait for new accumulation to complete
```
---
## MULTI-TIMEFRAME EXAMPLE
### Weekly Chart: Phase E Markup (Bullish)
```
╱
╱
╱ Long-term uptrend
╱
───╱─────
```
### Daily Chart: Re-Accumulation Phase C
```
┌─────────┐
│ Spring │ ← We are here
│ ▼ │
─────┴────█────┴─────
▲
```
### 4-Hour Chart: Entry Timing
```
Last 48 hours:
─────╨───── Spring occurred
█
▲ ← Enter now
■
```
**Result:** Triple confirmation across timeframes = High probability trade
---
## PROFIT TARGETS (Visual Guide)
### Method 1: Basic Measured Move
```
Resistance: 120 ┐ ─────────
│
│ 20 points
│
Support: 100 ┘ ─────────
Breakout: 120
Target: 120 + 20 = 140
╱╱╱ 140 (Target)
╱╱╱
╱╱╱
──────◄ 120 (Breakout)
│
Range │ 20
│
──────┘ 100
```
### Method 2: Multiple Targets
```
╱╱╱ 150 (Target 3: 2.5x) - 20% position
╱╱╱
╱╱╱ 140 (Target 2: 2x) - 30% position
╱╱╱
─────◄╱ 130 (Target 1: 1x) - 50% position
│
10 │ 120 (Breakout)
│
─────┘ 110 (Support)
```
### Method 3: Trailing Stop
```
1. Move stop to breakeven at Target 1
2. Trail stop under swing lows
3. Let winners run
╱╱╱
╱ ╱╱ ← Trail stop here
╱╱ ╱
╱ ╱ ← Then here
─────◄──╱
← Start here (breakeven)
```
---
## TIMING ENTRIES (Exact Bar Patterns)
### Perfect Spring Entry
```
Bar 1: ▼ Breaks below (Low vol)
█
Bar 2: ▲ Reverses (Closes strong)
█ ◄─ ENTER HERE
Bar 3: ■ Confirms
▲
DON'T WAIT for Bar 3!
Enter on Bar 2 close
```
### Perfect UTAD Entry
```
Bar 1: ▲ Breaks above (Spike vol OK)
█
Bar 2: ▼ Reverses (Closes weak)
█ ◄─ ENTER HERE
Bar 3: ■ Confirms
▼
SHORT on Bar 2 close
Don't wait for more confirmation
```
---
## COMPOSITE OPERATOR PSYCHOLOGY
### What Smart Money Does (Follow Them)
**Accumulation:**
```
1. Create fear (PS, SC)
2. Shake out weak hands (Spring)
3. Absorb supply quietly (Phase B)
4. Test for remaining supply (Test)
5. Mark it up (SOS → Phase E)
💰 They buy LOW when retail panics
```
**Distribution:**
```
1. Create euphoria (PSY, BC)
2. Trap late buyers (UTAD)
3. Distribute to buyers (Phase B)
4. Test for remaining demand (ST)
5. Mark it down (SOW → Phase E)
💰 They sell HIGH when retail buys
```
### Where to Look for Smart Money
```
💰 Buy signals appear at:
- Demand zones (green boxes)
- Springs and shakeouts
- Tests of support
- After selling climax
💰 Sell signals appear at:
- Supply zones (red boxes)
- UTAD and upthrusts
- Weak rallies (LPSY)
- After buying climax
```
---
## PRACTICE EXERCISES
### Exercise 1: Identify the Phase
Look at any chart and ask:
1. Is there a trading range? (Phase B likely)
2. Did we just stop a trend? (Phase A)
3. Was there a spring/UTAD? (Phase C)
4. Is there a breakout? (Phase D)
5. Is trend running? (Phase E)
### Exercise 2: Volume Analysis
For each bar, note:
- Volume level (High/Normal/Low)
- Spread (Wide/Normal/Narrow)
- Effort vs Result (Matching? Diverging?)
### Exercise 3: Find Historical Springs
Go back 6 months:
- Mark all springs you can find
- Note the setup before each
- Track what happened after
- Calculate win rate
---
## FINAL VISUALIZATION: The Complete Cycle
```
ACCUMULATION → MARKUP → DISTRIBUTION → MARKDOWN → ACCUMULATION...
Distribution Accumulation
(Top) (Bottom)
┌───────────────┐ ┌───────────────┐
│ BC UTAD │ │ Spring SC │
│ │ │ │ │ │ │ │
────┴───┴───┴───────┴─╲ ╱────────┴───┴───┴────
╲ ╱
Markdown ╲ ╱ Markup
(Phase E) ╲ ╱ (Phase E)
╲ ╱
╲ ╱
╲ ╱
╲ ╱
V
The market cycles endlessly
Your job: Identify where you are in the cycle
Trade accordingly
```
---
**Remember:**
- 📊 Study charts daily
- 📝 Journal every setup
- 🎯 Wait for the best signals
- 💰 Follow smart money
- ⏰ Be patient
- 🚀 Let winners run
**The indicator does the heavy lifting - you make the decisions!**

Core Suite Essentials This script provides institutional-grade, multi-factor market analysis in a unified toolkit. Its true sophistication lies in its ability to reveal the critical interplay—the "dance"—between its core components, offering a profound view of market structure, momentum, and trend health that goes far beyond standard indicators.
Core Differentiators
Reveals the Core Trend "Dance":
The script masterfully visualizes the critical interaction between three foundational elements:
Ichimoku (Tenkan Sen & Kijun Sen): The leading actors defining momentum and equilibrium.
Bollinger Middle Band (BBM): The dynamic stage of support/resistance.
This interaction provides an institutional-grade read on trend integrity:
Strong Trend: A clean, bullish alignment with the Tenkan Sen leading, the Kijun Sen following, and the BBM acting as firm support confirms a powerful, unified move.
Trend Break Warning: The BBM moving between the Tenkan and Kijun signals convergence and compression, a critical alert of weakening momentum and a potential reversal.
Multi-Timeframe Momentum Confirmation:
This core trend analysis is fortified with a layered momentum gauge, providing a robust, institutional-style confirmation system:
Proprietary RSI-Based Bands across weekly, daily, and intraday frames.
Stochastic Channels (Sto12/Sto50) for additional context on price position.
Strategic Filters for Swing & Position Traders:
For higher-timeframe analysis, it delivers essential quantitative tools:
AnEMA29 Angle: Objectively quantifies trend strength and direction.
PDMDR (DMI Ratio): Measures directional dominance to filter low-conviction markets.
Integrated Cross-Asset Intelligence:
Completing the institutional perspective is a Correlation & Hedging Assistant, contextualizing price action against peers and identifying strategic opportunities based on RSI divergences.
Conclusion
This is not a mere collection of indicators; it is a consolidated analytical workstation. It captures the nuanced "dance" of the core trend triad, layers on multi-timeframe momentum confirmation, and provides strategic filters for timing and cross-asset context. This holistic, institutional-grade approach delivers a definitive and actionable market narrative.
ICHIMOKU
@insomniac_vampire

Multi EMA + Indicators + Mini-Dashboard + Reversals v6📘 Multi EMA + Indicators + Mini-Dashboard + Reversals v6
🧩 Overview
This indicator is a multi-EMA setup that combines trend, momentum, and reversal analysis in a single visual framework.
It integrates four exponential moving averages (EMAs), key oscillators (RSI, MACD, Stochastic, CCI), volatility filtering (ATR), and a dynamic mini-dashboard that summarizes all signals in real time.
Its purpose is to help traders visually confirm trend alignment, filter valid entries, and identify possible trend continuation or reversal points.
It can display buy/sell arrows, detect reversal candles, and issue alerts when trading conditions are met.
⚙️ Core Components
1. Moving Averages (EMA Setup)
EMA1 (fast) and EMA2 (medium) define the short-term trend and trigger bias.
When the price is above both EMAs → bullish bias.
When below → bearish bias.
EMA3 and EMA4 act as trend filters. Their slopes (up or down) confirm overall momentum and help validate signals.
Each EMA has customizable lengths, sources, and colors for up/down trends.
This “EMA stack” is the foundation of the setup — a structured trend-following framework that adapts to market speed and volatility.
2. Momentum and Confirmation Filters
Each indicator can be individually enabled or disabled for flexibility.
RSI: confirms direction (above/below 50).
MACD: detects momentum crossover (MACD > Signal for bullish confirmation).
Stochastic: identifies trend continuation (K > D for longs, K < D for shorts).
CCI: adds trend bias above/below a threshold.
ATR Filter: filters out small, low-volatility candles to reduce noise.
You can activate only the filters that fit your trading plan — for instance, trend traders often use RSI and MACD, while scalpers may rely on Stochastic and ATR.
3. Reversal Detection
The indicator includes an optional Reversal Section that independently detects potential turning points.
It combines multiple configurable criteria:
Candlestick patterns (Bullish Hammer, Shooting Star).
Large Candle filter — detects unusually large bars (relative to close).
Price-to-EMA distance — identifies overextended moves that might revert.
RSI Divergence — detects potential momentum shifts.
RSI Overbought/Oversold zones (70/30 by default).
Doji Candles — sign of indecision.
A bullish or bearish reversal signal appears when enough selected criteria are met.
All sub-modules can be toggled on/off individually, giving you full control over sensitivity.
4. Signal Logic
Buy and sell signals are triggered when EMA alignment and the chosen confirmations agree:
Buy Signal
→ Price above EMA1 & EMA2
→ Confirmations (RSI/MACD/Stoch/CCI/ATR) pass
→ Trend filters (EMA3/EMA4) point upward
Sell Signal
→ Price below EMA1 & EMA2
→ Confirmations align bearishly
→ Trend filters (EMA3/EMA4) slope downward
Reversal signals can appear independently, even against the current EMA trend, depending on your settings.
5. Visual Dashboard
A mini-dashboard appears near the chart showing:
Current trade bias (LONG / SHORT / NEUTRAL)
EMA3 and EMA4 trend directions (↑ / ↓)
Quick visual bars (🟩 / 🟥) for each filter: RSI, MACD, Stoch, ATR, CCI, EMA filters
Reversal criteria status (Doji, RSI divergence, candle size, etc.)
This panel gives you a compact overview of all indicator states at a glance.
The color of the panel changes dynamically — green for bullish, red for bearish, gray for neutral.
6. Alerts
Built-in alerts allow automation or notifications:
Buy Alert
Sell Alert
Reversal Buy
Reversal Sell
You can connect these alerts to TradingView notifications or external bots for semi-automated execution.
💡 How to Use
✅ Trend-Following Setup
Focus on trades in the direction of EMA1 & EMA2.
Confirm with EMA3 & EMA4 trending in the same direction.
Use RSI/MACD/Stoch filters to ensure momentum supports the trade.
Avoid entries when ATR filter indicates low volatility.
🔄 Reversal Setup
Enable the Reversal section for potential tops/bottoms.
Look for reversal buy signals near support zones or after strong downtrends.
Use RSI divergence or Doji + Hammer signals as confirmation.
Combine with key chart areas (supply/demand or previous swing levels).
⚖️ Combination Approach
Trade continuation signals when all EMAs are aligned and filters are green.
Trade reversals only when at a key area (support/resistance) and confirmed by reversal conditions.
Always check higher-timeframe bias before entering a trade.
🧭 Practical Tips
Use different EMA sets for different timeframes:
9/21/50/100 for swing or trend trades.
5/13/34/89 for intraday scalping.
Turn off filters you don’t use to reduce lag.
Always validate signals with price structure, not just indicator alignment.
Practice in replay mode before live trading.
🗺️ Key Chart Confluence (Highly Recommended)
Although the indicator provides structured signals, its best use is in confluence with:
Support and resistance levels
Supply/demand zones
Trendlines and channels
Liquidity pools
Volume clusters
Signals aligned with strong key areas on the chart tend to have greater reliability than isolated indicator triggers.
I use EMA 1 - 20 Open ; EMA 2 - 20 Close ; EMA 3 - 50 ; EMA 4 - 200 or 100 , but that's me...
⚠️ Important Disclaimer
This indicator is a technical tool, not a guarantee of results.
Trading involves risk, and no signal is ever 100% accurate.
Every trader should develop a personal strategy, use proper risk management, and adapt settings to their instrument and timeframe.
Always combine indicator signals with key chart areas, higher-timeframe context, and your own analysis before taking a trade.

Liquidity & Momentum Master (LMM)💎 Liquidity & Momentum Master (LMM)
A professional dual-system indicator that combines:
📦 High-Volume Support/Resistance Zones and
📊 RSI + Bollinger Band Combo Signals — to visualize both smart money footprints and momentum reversals in one clean tool.
🧱 1. High-Volume Liquidity Zones (Support/Resistance Boxes)
Conditions
Visible only on 1H and higher timeframes (1H, 4H, 1D, etc.)
Detects candles with abnormally high volume and strong ATR-based range
Separates bullish (support) and bearish (resistance) zones
Visualization
All boxes are white, with adjustable transparency (alphaW, alphaBorder)
Each box extends to the right automatically
Only the most important (Top-N) zones are kept — weaker ones are removed automatically
Interpretation
White boxes = price areas with heavy liquidity and volume concentration
Price approaching these zones often leads to bounces or rejections
Narrow spacing = consolidation, wide spacing = potential large move
💎 2. RSI Exit + BB-RSI Combo Signals
RSI Exit (Overbought/Oversold Recovery)
RSI drops from overbought (>70) → plots red “RSI” above the candle
RSI rises from oversold (<30) → plots green “RSI” below the candle
Works on 15m, 30m, 1H, 4H, 1D
→ Indicates short-term exhaustion recovery
BB-RSI Combo (Momentum Reversal Confirmation)
Active on 1H and higher only
Requires both:
✅ RSI divergence (bullish or bearish)
✅ Bollinger Band re-entry (after temporary breakout)
Combo Buy (Green Diamond)
Bullish RSI divergence
Candle closes back above lower Bollinger Band
Combo Sell (Red Diamond)
Bearish RSI divergence
Candle closes back below upper Bollinger Band
→ Confirms stronger reversal momentum compared to standard RSI signals

Bollinger Band ToolkitBollinger Band Toolkit
An advanced, adaptive Bollinger Band system for traders who want more context, precision, and edge.
This indicator expands on the classic Bollinger Bands by combining statistical and volatility-based methods with modern divergence and squeeze detection tools. It helps identify volatility regimes, potential breakouts, and early momentum shifts — all within one clean overlay.
🔹 Core Features
1. Adaptive Bollinger Bands (σ + ATR)
Classic 20-period bands enhanced with an ATR-based volatility adjustment, making them more responsive to true market movement rather than just price variance.
Reduces “overreacting” during chop and avoids bands collapsing too tightly during trends.
2. %B & RSI Divergence Detection
🟢 Green dots: Positive %B divergence — price makes a lower low, but %B doesn’t confirm (bullish).
🔴 Red dots: Negative %B divergence — price makes a higher high, but %B doesn’t confirm (bearish).
✚ Red/green crosses: RSI divergence confirmation — momentum fails to confirm the price’s new extreme.
These signals highlight potential reversal or slowdown zones that are often invisible to the naked eye.
3. Bollinger Band Squeeze (with Volume Filter)
Yellow squares (■) show periods when Bollinger Bands are at their narrowest relative to recent history.
Volume confirmation ensures the squeeze only triggers when both volatility and participation contract.
Often marks the “calm before the storm” — breakout potential zones.
4. Multi-Timeframe Breakout Markers
Optionally displays breakouts from higher or lower timeframes using different colors/symbols.
Lets you see when a higher timeframe band break aligns with your current chart — a strong trend continuation signal.
5. Dual- and Triple-Band Visualization (±1σ, ±2σ, ±3σ)
Optional inner (±1σ) and outer (±3σ) bands provide a layered volatility map:
Price holding between ±1σ → stable range / mean-reverting behavior
Price riding near ±2σ → trending phase, sustained momentum
Price touching or exceeding ±3σ → volatility expansion or exhaustion zone
This triple-band layout visually distinguishes normal movement from statistical extremes, helping you read when the market is balanced, expanding, or approaching its limits.
⚙️ Inputs & Customization
Choose band type (SMA/EMA/SMMA/WMA/VWMA)
Adjust deviation multiplier (σ) and ATR multiplier
Toggle individual features (divergence dots, squeeze markers, inner bands, etc.)
Multi-timeframe and colour controls for advanced users
🧠 How to Use
Watch for squeeze markers followed by a breakout bar beyond ±2σ → volatility expansion signal.
Combine divergence dots with RSI or price structure to anticipate slowdowns or reversals.
Confirm direction using multi-timeframe breakouts and volume expansion.
💬 Why It Works
This toolkit transforms qualitative chart reading (tight bands, hidden divergence) into quantitative, testable conditions — giving you objective insights that can be backtested, coded, or simply trusted in live setups.

cd_indiCATor_CxGeneral:
This indicator is the redesigned, simplified, and feature-enhanced version of the previously shared indicators:
cd_cisd_market_Cx, cd_HTF_Bias_Cx, cd_sweep&cisd_Cx, cd_SMT_Sweep_CISD_Cx, and cd_RSI_divergence_Cx.
Within the holistic setup, the indicator tracks:
• HTF bias
• Market structure (trend) in the current timeframe
• Divergence between selected pairs (SMT)
• Divergence between price and RSI values
• Whether the price is in an important area (FVG, iFVG, and Volume Imbalance)
• Whether the price is at a key level
• Whether the price is within a user-defined special timeframe
The main condition and trigger of the setup is an HTF sweep with CISD confirmation on the aligned timeframe.
When the main condition occurs, the indicator provides the user with a real-time market status summary, enriched with other data.
________________________________________
What’s new?
-In the SMT module:
• Triad SMT analysis (e.g.: NQ1!, ES1!, and YM1!)
• Dyad SMT analysis (e.g.: EURUSD, GBPUSD)
• Alternative pair definition and divergence analysis for non-correlated assets
o For crypto assets (xxxUSDT <--> xxxUSDT.P) (e.g.: SOLUSDT.P, SOLUSDT)
o For stocks, divergence analysis by comparing the asset with its value in another currency
(BIST:xxx <--> BIST:xxx / EURTRY), (BAT:xxx <--> BAT:xxx / EURUSD)
-Special timeframe definition
-Configurable multi-option alarm center
-Alternative summary presentation (check list / status table / stickers)
________________________________________
Details and usage:
The user needs to configure four main sections:
• Pair and correlated pairs
• Timeframes (Auto / Manual)
• Alarm center
• Visual arrangement and selections
Pair Selections:
The user should adjust trading pairs according to their trade preferences.
Examples:
• Triad: NQ1!-ES1!-YM1!, BTC-ETH-Total3
• Dyad: NAS100-US500, XAUUSD-XAGUSD, XRPUSDT-XLMUSDT
Single pairs:
-Crypto Assets:
If crypto assets are not in the triad or dyad list, they are automatically matched as:
Perpetual <--> Spot (e.g.: DOGEUSDT.P <--> DOGEUSDT)
If the asset is already defined in a dyad list (e.g., DOGE – SHIB), the dyad definition takes priority.
________________________________________
-Stocks:
If stocks are defined in the dyad list (e.g.: BIST:THYAO <--> BIST:PGSUS), the dyad definition takes priority.
If not defined, the stock is compared with its value in the selected currency.
For example, in the Turkish Stock Exchange:
BIST:FENER stock, if EUR is chosen from the menu, is compared as BIST:FENER / OANDA:EURTRY.
Here, “OANDA” and the stock market currency (TRY) are automatically applied for the exchange rate.
For NYSE:XOM, its pair will be NYSE:XOM / EURUSD.
________________________________________
Timeframes:
By default, the menu is set to “Auto.” In this mode, aligned timeframes are automatically selected.
Aligned timeframes (LTF-HTF):
1m-15m, 3m-30m, 5m-1h, 15m-4h, 1h-D, 4h-W, D-M
Example: if monitoring the chart on 5m:
• 1h sweep + 5m CISD confirmation
• D sweep + 1h CISD confirmation (bias)
• 5m market structure
• 1h SMT and 1h RSI divergence analysis
For manual selections, the user must define the timeframes for Sweep and HTF bias.
FVG, iFVG, and Volume Imbalance timeframes must be manually set in both modes.
________________________________________
Alarm Center:
The user can choose according to preferred criteria.
Each row has options.
“Yes” → included in alarm condition.
“No” → not included in alarm condition.
If special timeframe criteria are added to the alarm, the hour range must also be entered in the same row, and the “Special Zone” tab (default: -4) should be checked.
Key level timeframes and plot options must be set manually.
Example alarm setup:
Alongside the main Sweep + CISD condition, if we also want HTF bias + Trend alignment + key level (W, D) and special timeframe (09:00–11:00), we should set up the menu as follows:
________________________________________
Visual Arrangement and Selections:
Users can control visibility with checkboxes according to their preferences.
In the Table & Sticker tab, table options and labels can be controlled.
• Summary Table has two options: Check list and Status Table
• From the HTF bias section, real-time bias and HTF sweep zone (optional) are displayed
• The RSI divergence section only shows divergence analysis results
• The SMT 2 sub-section only functions when triad is selected
Labels are shown on the bar where the sweep + CISD condition occurs, displaying the current situation.
With the Check box option, all criteria’s real-time status is shown (True/False).
Status Table provides a real-time summary table.
Although the menu may look crowded, most settings only need to be adjusted once during initial use.
________________________________________
What’s next?
• Suggestions from users
• Standard deviation projection
• Mitigation/order blocks (cd special mtg)
• PSP /TPD
________________________________________
Final note:
Every additional criterion in the alarm settings will affect alarm frequency.
Multiple conditions occurring at the same time is not, by itself, sufficient to enter a trade—you should always apply your own judgment.
Looking forward to your feedback and suggestions.
Happy trading! 🎉

[Smith] VWAP Deviation + VWAP Deviation +
Short Description:
Advanced VWAP indicator with deviation bands, smart signal filtering, and session-based performance tracking. Features log-space scaling, RSI confirmation, volume filters, and market regime detection.
Full Description:
The VWAP Deviation + is a comprehensive trading indicator that combines Volume Weighted Average Price (VWAP) analysis with advanced signal filtering to identify high-probability trade opportunities. This indicator goes beyond basic VWAP by incorporating multiple confirmation layers and intelligent market analysis.
🎯 Key Features
Core VWAP Analysis:
- Custom volume-weighted mean calculation with deviation bands (2σ and 3σ)
- Optional log-space scaling for proportional price movements
- Real-time VWAP line with customizable visibility
Smart Signal Detection:
- RSI confirmation for all trade signals
- Volume filter requiring above-average trading activity
- Market regime detection (trending vs ranging markets)
- Optional RSI divergence analysis
Advanced Filtering:
- Multi-condition signal validation
- Session-based performance tracking (Asian, London, NY)
- Real-time win rate calculation
- Strong vs regular signal classification
Visual Features:
- Clean, professional interface with customizable colors
- Optional signal shapes and annotations
- Performance statistics table
- Filled deviation bands for easy visualization
📊 How It Works
The indicator identifies trade opportunities when:
1. Price touches VWAP deviation bands (2σ or 3σ)
2. RSI confirms oversold/overbought conditions
3. Volume exceeds the specified threshold
4. Market regime conditions are favorable
Signal Types:
- LONG : Price at lower bands + RSI oversold + volume confirmation
- SHORT : Price at upper bands + RSI overbought + volume confirmation
- STRONG : Same conditions but at 3σ bands for higher conviction trades
⚙️ Customization Options
Core Settings:
- VWAP length and source selection
- Adjustable deviation multipliers
- Log-space scaling toggle
Signal Filters:
- RSI length and threshold levels
- Volume filter with customizable multiplier
- Market type filtering options
Advanced Features:
- Session statistics tracking
- RSI divergence detection
- Market regime analysis
Visual Controls:
- Show/hide individual components
- Custom color schemes
- Signal display toggles
🔔 Alert System
Built-in alerts for:
- Long and short trade opportunities
- Strong signal confirmations
- RSI divergence signals
💡 Best Practices
- Use higher timeframes (15m+) for more reliable signals
- Combine with additional confirmation indicators
- Pay attention to session statistics for timing optimization
- Monitor market regime indicators for context
This indicator is suitable for day traders, swing traders, and anyone looking to improve their VWAP-based trading strategies with advanced filtering and market analysis.
